Chart of the week: Odds favour a sharp rally soon
4th January 2016 13:41
by John Burford from interactive investor
Share on
A Happy New Year to all my readers!
Last year, I had some terrific calls and a few mis-hits (but that is why stop losses were invented). I believe it demonstrated that by using very simple chart reading methods, such as my Tramline Trading method, if you are an investor and/or a trader, you can put the odds of winning firmly on your side.
One of the distinct advantages of using my Tramline system is that it often can give you specific price targets where profits can be taken. This is probably the most difficult part of investing/trading. Entering a trade is the easy part: it is choosing the exit that is tough.
When you have a winning trade, how often have you wondered whether you should take profits? With my method, you need wonder no more.
And if you need just one more New Year's Resolution, how about this: I will keep my losses small and ride my winners. This is probably the oldest golden rule in the book, but the one most observed in its breach.
BHP Billiton - is there enough blood on the streets yet?
Last year, I covered a few miners, but not one of the biggies - . It is no secret that the mining industry had a torrid year with commodity raw material prices in freefall at times.
And to cap off an annus horribilis for BHP, the company faces not only the clean-up costs of the Brazil dam burst in November, but the prospect of a multi-billion-dollar fine.
The litany of company disasters has been well covered in the press, so my question remains: Has all of this bad news now been fully discounted in the share price?
There is little doubt that bullish sentiment remains practically non-existent - here is a recent article headline: Struggling iron ore market highlights reasons to short BHP Billiton in 2016. With headlines like that, and with the shares having collapsed from £16 last May to the current £7 range, I am now actively looking for reasons to buy (and/or cover shorts).
Of course, there is no shortage of "reasons to short" if you still erroneously believe that it is the fundamentals that drive markets. There is the slowdown in China that will therefore keep the lid on iron ore prices. Then there are the looming Fed interest rate hikes in 2016 that will result in larger interest payments on company bonds and thereby reduce profits.
But what do the charts tell me? Before I get to the current position, I want to show you the chart action in 2014 which highlights a few fundamental principles of my analysis methods:
(Click to enlarge)
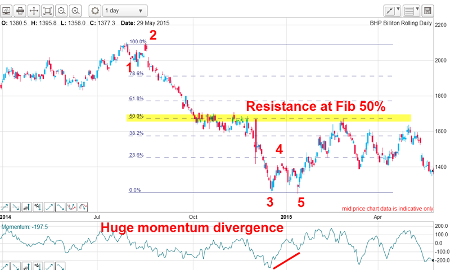
The move down off the £21 high in July 2014 is in five motive waves and at the wave 5 low, the momentum divergence from that at the wave 3 low is massive. This almost always signals a sharp rebound - and a tradable event.
The ensuing rally carried precisely to the Fibonacci 50% resistance level before turning back down. That hit was also a tradable event. A profit of around £3 or £4 was available before re-shorting.
Incidentally, it never fails to amaze me that corrective rallies/declines often stop at either the 50% or 62% levels pretty much on the button - and you can use this information to set your trade entries (and exits) to grab a low-risk trade where protective stops can be set close to entry.
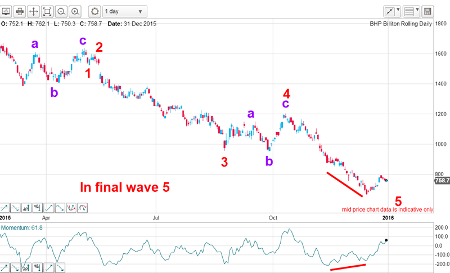
Fast forward to today, and this is the chart showing the action last year:
(Click to enlarge)
In this large wave, the market is finishing up the final ending wave 5 and on a large momentum divergence (potentially bullish). Here is the wave 5 in close up:
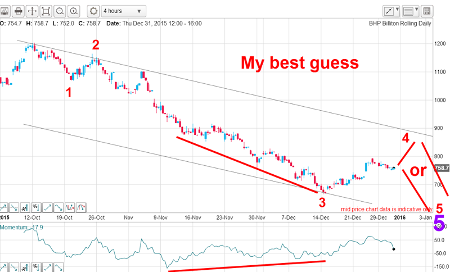
(Click to enlarge)
It appears we are in wave 4 up of large wave 5, and the market could push up to my upper tramline before declining in wave 5 of 5, or it could decline from near current levels.
But my waves would look much better with one more dip below £7.
Outlook
Odds favour one more dip - and that would be the final decline before a decent rally ensues.
Update on Pearson
I covered this chart on 21 December and this was chart then:
(Click to enlarge)
It was straight down most of the year and I was bearish on it right from the start of my coverage in the Spring. I concluded that "no end was in sight for the low" and that short positions were in little danger.
But since then, the market has put in a pattern that has the potential to signal a recovery.
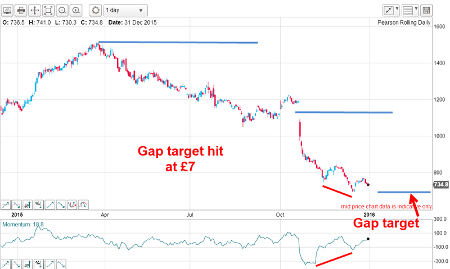
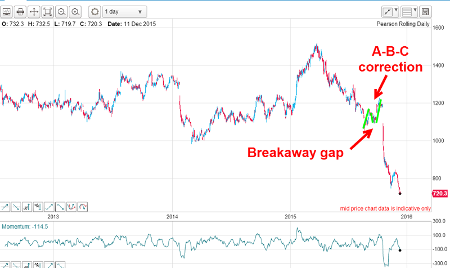
(Click to enlarge)
First, when there is a significant breakaway gap, it often falls about half-way along a trend. My blue markers are at the top, then at the mid-point of the gap and then the measured target at the £7 area. The low so far is £6.96 on 4 December. That makes it a direct bulls-eye hit.
Second, there is a large positive momentum divergence at this low, signalling a likely sharp reversal ahead.
Outlook
With this evidence, it is prudent to take at least partial profits on shorts around here and place a protective buy-stop on the remainder in the £8.40 area.
Odds favour a sharp rally soon, but this will be counter-trend, at least until I see a particular wave pattern develop, which I shall report on here if it appears.
But once the rally gets a head of steam, a gigantic short squeeze should take the market to the £11 mark at least.
This article is for information and discussion purposes only and does not form a recommendation to invest or otherwise. The value of an investment may fall. The investments referred to in this article may not be suitable for all investors, and if in doubt, an investor should seek advice from a qualified investment adviser.
These articles are provided for information purposes only. Occasionally, an opinion about whether to buy or sell a specific investment may be provided by third parties. The content is not intended to be a personal recommendation to buy or sell any financial instrument or product, or to adopt any investment strategy as it is not provided based on an assessment of your investing knowledge and experience, your financial situation or your investment objectives. The value of your investments, and the income derived from them, may go down as well as up. You may not get back all the money that you invest. The investments referred to in this article may not be suitable for all investors, and if in doubt, an investor should seek advice from a qualified investment adviser.
Full performance can be found on the company or index summary page on the interactive investor website. Simply click on the company's or index name highlighted in the article.
Disclosure
We use a combination of fundamental and technical analysis in forming our view as to the valuation and prospects of an investment. Where relevant we have set out those particular matters we think are important in the above article, but further detail can be found here.
Please note that our article on this investment should not be considered to be a regular publication.
Details of all recommendations issued by ii during the previous 12-month period can be found here.
ii adheres to a strict code of conduct. Contributors may hold shares or have other interests in companies included in these portfolios, which could create a conflict of interests. Contributors intending to write about any financial instruments in which they have an interest are required to disclose such interest to ii and in the article itself. ii will at all times consider whether such interest impairs the objectivity of the recommendation.
In addition, individuals involved in the production of investment articles are subject to a personal account dealing restriction, which prevents them from placing a transaction in the specified instrument(s) for a period before and for five working days after such publication. This is to avoid personal interests conflicting with the interests of the recipients of those investment articles.