How oil prices have performed since 1861!
27th January 2016 17:36
by Lee Wild from interactive investor
Share on
If anyone still doubts whether the oil price is currently the most significant driver of global equity markets, just look at the Wednesday afternoon.
As London shares began trading, Brent crude was down 80 cents from Monday's close of $31.80 a barrel. When it began to pick up at lunchtime, share prices followed, culminating in a spectacular rally into the close which saw both markets spike to intraday highs.
Brent surged 4% to $32.59 in the hour before the London stockmarket closed at 4.30pm, driven by data indicating an upsurge in demand for heating oil (distillates) in the US. In that time, the FTSE 100 leapt almost 70 points, or 1.2%, to a two-week high at 5,990.
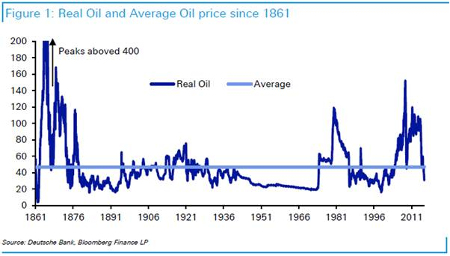
These are volatile times indeed, but it's been worse. To illustrate the fact, the historians at Deutsche Bank have traced back movements in oil prices over the past 155 years, and the resulting charts are quite amazing.
According to the bank's data, the average price in today's money since 1861 is $47 a barrel, which means current prices are low, but not significantly lower relative to long-term history.
"Nevertheless in this year's long-term study, if prices stay at similar levels it will be the first time our long-term mean reversion exercise will show positive return expectations for Oil since we first started it over a decade ago," writes Deutsche strategist Jim Reid.
"Our long-held belief is that commodities that are factors of production are unlikely to outstrip inflation over the long-term as, if they do, there will be alternatives found. Clearly this can take years, if not decades, to resolve, so even if we're correct, commodity cycles can still last a long time before they eventually mean-revert.
"Overall, the graph doesn't suggest that current levels are as extreme as many would suggest, even if long-term value has returned. The $140 prices a few years back look especially bubble-like in a long-term prospective."
There's also a chart plotting US recessions since the early 1970s and the price of oil. Since the post-war Bretton Woods period (during which time prices were largely fixed), the average real price since then $57.7.
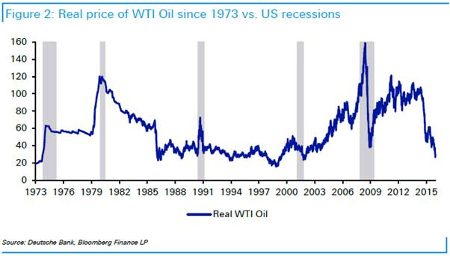
As Reid points out, there's been a significant spike in oil prices ahead of the five recessions seen over this period. "While there are many potential drivers of a recession, it is food for thought when you look at the current situation.
"As we say on a regular basis, we are firmly in the secular stagnation camp, but have some sympathy that the consumer is getting a big benefit at the moment from the sharp fall in oil."
This article is for information and discussion purposes only and does not form a recommendation to invest or otherwise. The value of an investment may fall. The investments referred to in this article may not be suitable for all investors, and if in doubt, an investor should seek advice from a qualified investment adviser.