Have central banks restarted bull market?
21st March 2016 12:24
by Lance Roberts from ii contributor
Share on
Did Yellen just release the bull?
The question we must now answer is whether the recent actions by the Bank of Japan, European Central Bank and Federal Reserve have provided the markets with enough "fire power" to return the markets to a bullish trend?
Let's start with a short-term (daily) view, as there are some interesting observations. I have added some notations to the chart I posted earlier this week. As I stated then, there is a lot going on in this chart.
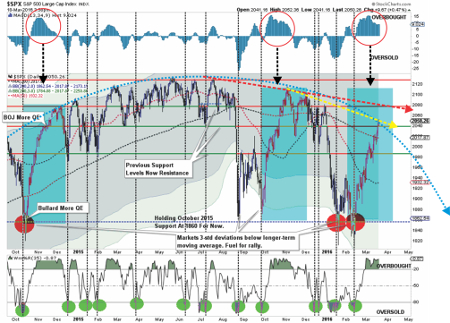
- The shaded areas represent two and three standard deviations of price movement from the 125-day moving average (DMA). I am using a longer-term moving average here to represent more extreme price extensions of the index. The last four times prices were three standard deviations below the moving average, the subsequent rallies were very sharp as short positions were forced to cover.
- The top and bottom of the chart show the overbought or oversold conditions of the market. The recent rally has responded as expected from recent oversold conditions. With the oversold condition now exhausted, the potential for further upside has been greatly reduced.
- The red circles denote the previous two times that the markets were as overbought as they are now. Notice the condition peaked during the middle of the advance and began to wane as the rally reached its conclusion. In both previous events, the ensuing correction was fairly sharp.
- The red and yellow dashed lines show the current descending trend lines that continue to provide resistance to the advance. Furthermore, the easiest path for prices continues to be lower, as downward resistance continues to be built. The arching dashed blue line shows the change of overall advancing to now declining price trends.
However, if the "bulls" have indeed returned to the market, as is being suggested by the mainstream media, we should see longer-term measures of market momentum and relative strength turning more positive.
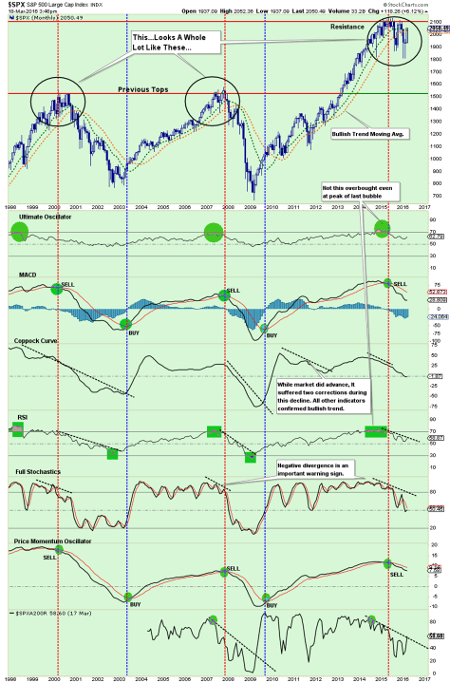
As you will notice, there has been virtually no improvement in longer-term indicators at this point that would suggest a more "bullish" optimism is prevailing in the markets.
At the very bottom of the chart above is the number of stocks trading above the 200 DMA on the S&P 500.
Currently, with the overall index trading well above the 200 DMA, only 58.6% of stocks are currently doing the same. This suggests a rather narrow rally over the last month and explains the lack of momentum of the overall index.
Even on a shorter-term timeframe, the recent rally has failed to reverse the negative trend of the market, which has been a hallmark of the "broadening topping" process seen at the peaks of the last two markets.
While my "emotions" are currently screaming to start increasing equity allocations at this juncture, there are several reasons why my discipline is keeping me from doing so currently:
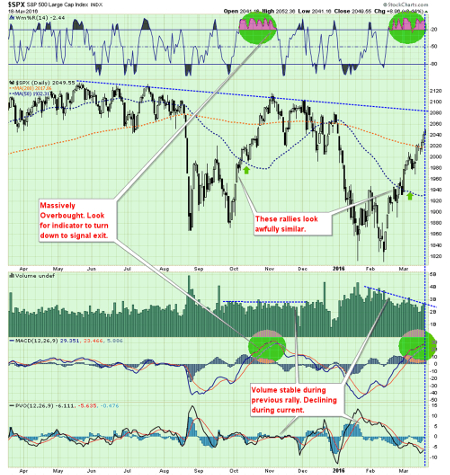
1. The market is grossly overbought in the short-term and will have either a mild corrective process or consolidation to allow for an increase in equity exposure.
2. Negative trends are still in place, which suggests the current rally, while significant, remains within the context of a reflexive rally.
3. Volume is declining on the rally, suggesting a lack of conviction.
4. This rally looks very similar to the rally last October, except the fundamentals are substantially weaker.
Waiting for change
As discussed throughout this weekend's missive, there is ample evidence suggesting a more cautionary approach remains the correct course of action for now. Therefore, we continue to wait, watch and prepare.
As stated two weeks ago:
There is now little for us to do except to wait, and watch patiently, for the market to either confirm a "bear market", or stabilize and begin to rebuild the bullish supports necessary to allow equity risk to once again be increased.
Neither situation will make itself apparent in short order - so relax as we let the market dictate what actions we take next. "Guessing" at the markets has not typically been a successful and repeatable strategy. As stated above, while very short-term indicators have improved, the longer-term signals have not.
This article is for information and discussion purposes only and does not form a recommendation to invest or otherwise. The value of an investment may fall. The investments referred to in this article may not be suitable for all investors, and if in doubt, an investor should seek advice from a qualified investment adviser.
Lance Roberts is a Chief Portfolio Strategist/Economist for Clarity Financial. He is also the host of "The Lance Roberts Show" and Chief Editor of the "Real Investment Advice" website and author of The "Real Investment Daily" blog and the "Real Investment Report". Follow Lance on Facebook, Twitter and Linked-In