Chart of the week: Huge moment for Barclays
18th April 2016 10:33
by John Burford from interactive investor
Share on
Update on Barclays
I have been bearish on for many months as I have with the entire banking sector. Not only was the 2015 commodity bust going to hurt earnings, but I figured banks would need to set aside capital for many more loans that would go bad (impairment charge). Also, falling interest rates would crimp margins.
Indeed, that scenario has played out in spades with Barclays, which traded at a recent high of 280p last summer (where I first became interested in a shorting campaign) and has declined to the recent 145p print.
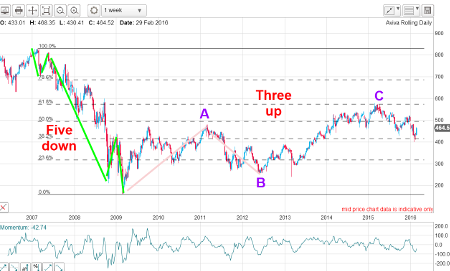
That high put in the final wave 5 of my famous Barclays Wedge that spanned seven years - a very long time for the market to trade in a narrowing band.
It is instructive to analyse the psychology of traders/investors in that time. Barclays has been a typical 'widows and orphans' stock - one to put in the back of the drawer and forget about as the dividend cheques roll in like clockwork.
In the past, bank shares have rarely been a target of day traders, short sellers and ten-baggers, but that all changed in the credit crunch of 2007-2009 when Barclays plunged from 750p to 47p - a staggering loss of 94% in value.
I would guess that most investors hung on for dear life through the crash - and still hold them seven years afterwards! And in common with most unsophisticated investors, they are hoping the shares will regain their former heights so that they can sell at a profit. Retail investors usually fear taking a loss - they see it as an act of cowardice or failure, perhaps.
But those heights seem as far away today as they were seven years ago. The best level reached was the 400p level set late in 2009 and each rally since then has fallen short of even that lowly figure. Imagine what long-term investors are thinking. At some point they are going to give up hope and finally sell - and typically that happens when the market is sliding again.
So the break of the lower tramline in November last year signalled the start of a renewed bout of stale long liquidation. But at some point, this selling dries up and that is usually when the news is really dreadful. I call that a selling exhaustion - and that is what occurred a few days ago, an event I was well prepared for.
This is what happens when a particular setup occurs in the wave count and sentiment. Here is the daily chart of the slide off my wave 5:
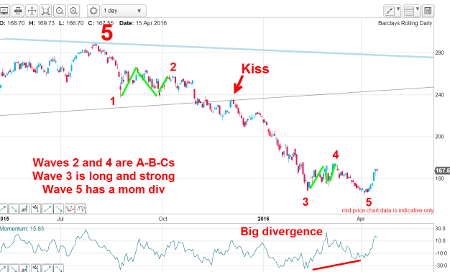
The break of the lower wedge line last year was a major sell signal and that was at the start of wave 3 down which progressed in textbook 'long and strong' fashion. I love third waves! They can usually be relied on to provide relentless fast action in your direction.
When wave 3 turned in February, the relief rally in wave 4 was in a typical A-B-C form that helped identify it as a genuine fourth wave. Then, a renewed slide to a new low occurred in wave 5, and on a very large momentum divergence, which told me the selling was drying up fast - and I had better take action.
Here is a close up of recent action:
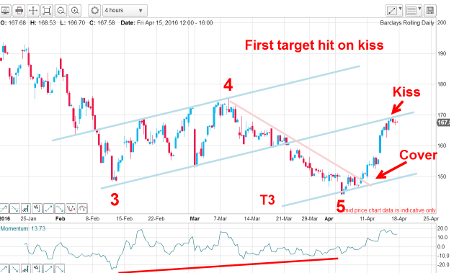
Wave 5 moved lower against my down-sloping pink tramline. But I could then draw a lovely blue tramline set with the equidistant T3 pointing to a target, which it hit on the nose earlier this month.
And when the market moved up above the pink tramline, that was my signal to take some profits off the table by covering some short positions. That was a superb whale trade from the 280p level to my 150p exit.
And, like a shot, the market staged a sharp rally to Friday's 170p high. Note that this was a kiss target I had set up beforehand. And was an area where I had a great interest in! A kiss on a rally to the underside of a major tramline is a key event, and indicates a high probability/low risk trade.
Market Flash
With crude oil in retreat this morning, Barclays is moving lower with the FTSE. If the kiss is genuine, I expect a scalded cat bounce down away from the centre tramline.
This article is for information and discussion purposes only and does not form a recommendation to invest or otherwise. The value of an investment may fall. The investments referred to in this article may not be suitable for all investors, and if in doubt, an investor should seek advice from a qualified investment adviser.
These articles are provided for information purposes only. Occasionally, an opinion about whether to buy or sell a specific investment may be provided by third parties. The content is not intended to be a personal recommendation to buy or sell any financial instrument or product, or to adopt any investment strategy as it is not provided based on an assessment of your investing knowledge and experience, your financial situation or your investment objectives. The value of your investments, and the income derived from them, may go down as well as up. You may not get back all the money that you invest. The investments referred to in this article may not be suitable for all investors, and if in doubt, an investor should seek advice from a qualified investment adviser.
Full performance can be found on the company or index summary page on the interactive investor website. Simply click on the company's or index name highlighted in the article.
Disclosure
We use a combination of fundamental and technical analysis in forming our view as to the valuation and prospects of an investment. Where relevant we have set out those particular matters we think are important in the above article, but further detail can be found here.
Please note that our article on this investment should not be considered to be a regular publication.
Details of all recommendations issued by ii during the previous 12-month period can be found here.
ii adheres to a strict code of conduct. Contributors may hold shares or have other interests in companies included in these portfolios, which could create a conflict of interests. Contributors intending to write about any financial instruments in which they have an interest are required to disclose such interest to ii and in the article itself. ii will at all times consider whether such interest impairs the objectivity of the recommendation.
In addition, individuals involved in the production of investment articles are subject to a personal account dealing restriction, which prevents them from placing a transaction in the specified instrument(s) for a period before and for five working days after such publication. This is to avoid personal interests conflicting with the interests of the recipients of those investment articles.