Chart of the week: A window on Microsoft
25th April 2016 12:51
by John Burford from interactive investor
Share on
A window on Microsoft
Today, I am veering slightly off-piste. Up till now, I have focused on components of the FTSE 100 because I believe these UK shares are the most interesting to most readers. But as you know, there is whole world of equities out there and, provided they are large-caps, I can consider them for analysis using my tramline trading methods.
Also, I do know that UK investors are not shy of investing or trading in overseas equities. That certainly was not the case a few years ago. But now, with modern trading platforms, there is a whole confusing world at your fingertips. Provided you do not fall in love with the "story" of a particular share or Exchange Traded Fund, one chart is as good as another, if it shows excellent conformity with my methods.
With that in mind, I shall cover , which can be considered the bellwether of the computing industry. When investing in these dollar-denominated shares (becoming a shareholder), you have an exchange rate risk (or opportunity), which is absent when spreadbetting. That should be kept in mind when you consider hedging activities.
The company is one of the pioneers of the PC software industry that has transformed the way we communicate, compute and access the internet. It introduced the first version of Windows in 1983 and latest-quarter revenue was reported at $22 billion (£15 billion).
Its IPO was 30 years ago with shares priced at $21. If you had bought 100 shares then, after stock splits they would be worth around $250,000 today.
But if you had sold them in December 1999, you would have netted $1.4 million - almost six times as much after holding for only eight years!
And thereby hangs a tale - one of timing. This is a theme I have been stressing mightily in my emails.
Here is the daily chart from the 2009 lows:
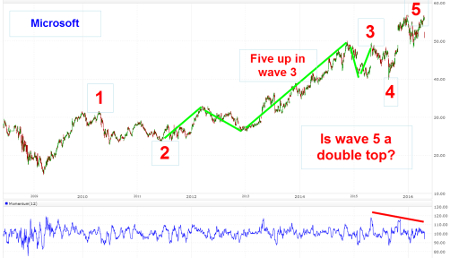
I have a classic large-scale impulsive Elliott wave, with the final wave five ending recently at the $57 region. Wave one is a beautiful five-up that is my textbook indicator that the trend had changed from down to up. Wave two is a typical A-B-C three-down that confirms the uptrend.
Then, wave three is a long and strong multi-year bull run that is made up of its own five-up (marked in green). In fact, this green five-up contains its own wave three that possesses its own five-up.
A diversion: What a stunning demonstration that waves within markets are fractals - self-similar swings that operate on all time scales. To show this, here is the 1-minute chart, which I defy anyone to tell apart from the daily chart (unless I told them the different time scales!):
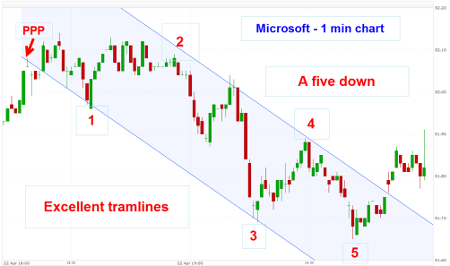
Even on this fine scale, I have a terrific tramline pair with a nice Prior Pivot Point (PPP) on the lower line. The trading channel contains all of the trading in the decline and this move is a complete five-down. When the fifth wave ended, the market rallied in what should be an A-B-C relief rally. Indeed, the market rallied hard with a gap as it passed above the upper tramline.
The upper tramline was a line of resistance, but with the five-wave completion and the break above it, it becomes a line of support.
On this very short time scale, I can tell that the A-B-C rally has probably completed, with the market having hit the Fibonacci 50% retrace of the entire move down. But keep in mind that the vertical scale covers less than 50 cents per share and is of interest to scalpers only!
But my point is that a day trader can use my methods if they wish to pick up pennies in front of steamrollers (as so many do). I prefer to position for decent swings that may take a few weeks or months to evolve.
To return to the daily chart, here is a close-up of recent action:
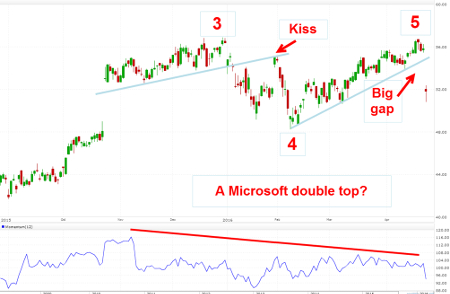
Waves three and five both ended at around the $57 level and that makes them possible candidates for a double top (DT). To qualify as a genuine DT, I like to see the peaks separated by at least six weeks, and this one does.
The decline off wave three is certainly interesting, as the blue support line was broken as wave four developed in an A-B-C form with the B wave kissing the underside of the blue line (now resistance).
Then, wave five rallied back to $57, but on Friday, the support line was broken with the huge gap down following disappointing results. This is a repeat of the action following the first blue support line break on poor results the previous quarter, albeit on a stronger break.
To cap it off, momentum has been declining since last year, as buying pressure was clearly weakening.
There is no doubt that Friday's 7% plunge has hurt the bullish case and, with a possible DT in place, the market may try to close the gap - but will have immense difficulty in breaking into new high ground.
Odds are strengthening that the trend has now turned down. A break of the wave four low at the $48 level should seal it.
This article is for information and discussion purposes only and does not form a recommendation to invest or otherwise. The value of an investment may fall. The investments referred to in this article may not be suitable for all investors, and if in doubt, an investor should seek advice from a qualified investment adviser.
These articles are provided for information purposes only. Occasionally, an opinion about whether to buy or sell a specific investment may be provided by third parties. The content is not intended to be a personal recommendation to buy or sell any financial instrument or product, or to adopt any investment strategy as it is not provided based on an assessment of your investing knowledge and experience, your financial situation or your investment objectives. The value of your investments, and the income derived from them, may go down as well as up. You may not get back all the money that you invest. The investments referred to in this article may not be suitable for all investors, and if in doubt, an investor should seek advice from a qualified investment adviser.
Full performance can be found on the company or index summary page on the interactive investor website. Simply click on the company's or index name highlighted in the article.
Disclosure
We use a combination of fundamental and technical analysis in forming our view as to the valuation and prospects of an investment. Where relevant we have set out those particular matters we think are important in the above article, but further detail can be found here.
Please note that our article on this investment should not be considered to be a regular publication.
Details of all recommendations issued by ii during the previous 12-month period can be found here.
ii adheres to a strict code of conduct. Contributors may hold shares or have other interests in companies included in these portfolios, which could create a conflict of interests. Contributors intending to write about any financial instruments in which they have an interest are required to disclose such interest to ii and in the article itself. ii will at all times consider whether such interest impairs the objectivity of the recommendation.
In addition, individuals involved in the production of investment articles are subject to a personal account dealing restriction, which prevents them from placing a transaction in the specified instrument(s) for a period before and for five working days after such publication. This is to avoid personal interests conflicting with the interests of the recipients of those investment articles.