Oversold, or market top?
23rd May 2016 11:12
by Lance Roberts from ii contributor
Share on
Another week of volatility, but with no real resolution to the burning question: "where do we go next?"
This past week, the release of the Federal Open Market Committee meeting minutes from April did little to solve the overall confusion. On Friday, I noted some key highlights from the minutes:
"Participants generally agreed that the risks to the economic outlook posed by global economic and financial developments had receded over the inter-meeting period.
Participants also raised concerns about "unanticipated developments" associated with how China manages its exchange rate.
Still, Fed officials signalled they weren't overly worried about the apparent [first-quarter GDP] slump, judging it was temporary and "could partly reflect measurement problems and, if so, would likely be following by stronger [gross domestic product] growth in subsequent quarters."
The view wasn't unanimous. Some officials worried that softness in consumer spending and declines in business investment may be a sign of a more persistent slowdown in economic activity.
There is a tremendous amount of "hope" built into those statements. And despite the continuing call of economic growth which has remained terminally elusive, the Federal Reserve is faced with numerous challenges ahead.
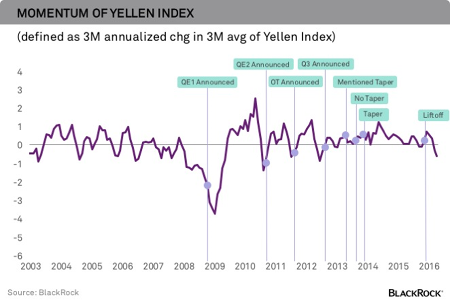
The central bank already missed the "window of opportunity" for normalizing rates in a manner that doesn't hamper the recovery. This is evident when you look at Janet Yellen's proprietary index that Yellen herself has stated as critical for Fed movement.
As I have repeated discussed in the past, since payrolls tend to track corporate profits by about six months and the small business confidence gauges are in decline, there will be weakening, not strengthening, in employment as the year progresses.
Such a slowing in payrolls will put the Fed in a difficult position, since their entire premise on hiking rates has been a rise in inflation to 2% and a fall to 5% in unemployment. Both have now been achieved. This is why, when combined with a forthcoming presidential election, the Fed will likely remain quite permanently on hold.
As Rick Reider at Blackrock recently summed up:
To be sure, we live in a world that always has risks and headwinds. But given the many headwinds to Fed movement today, the central bank could have taken the opportunity to move earlier in the year when the headwinds weren't as strong and it was being aided by historically easy global monetary policy in Europe and Japan.
Now, the central bank is left with a more difficult set of decisions going forward, as it weighs the costs and benefits of maintaining interest rates at "emergency conditions".
For Yellen, it is critical the market holds the current level of support. A break below that level will certainly send markets lower looking to retest February lows once again while completely derailing the Fed's plans for hiking rates.
The line in the sand
As of Friday morning, as I am writing this, the "good news" is the market rebounded sharply off of the critical support level at 2,040. That level has been acting as the "line in the sand" since April, and as stated above, a violation of that level will likely send stocks heading rapidly lower.
Furthermore, the markets have returned to a short-term oversold condition, which has historically provided a catalyst for high prices. Again, this is a very short-term condition that can be exhausted very quickly.
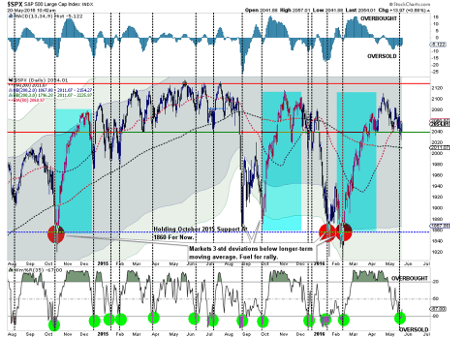
The "bad news" is that the rally on Friday failed to break back above the 50-day moving average (DMA). A failure to reclaim that ground by close of business on Monday will return the 50 DMA into resistance versus support.
However, stepping back to a "weekly" price chart, we see the market bouncing off of the short-term moving average putting the new downtrend resistance line at 2,090 in focus.
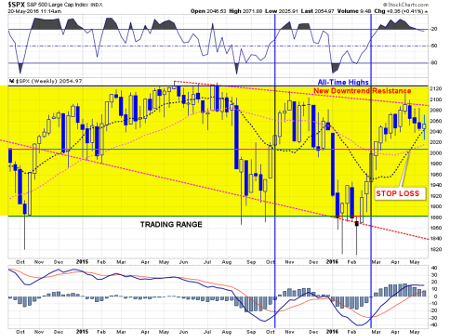
On a weekly basis, the markets remain extremely overbought following the rally from the February lows. This suggests that on an intermediate-term basis the path for prices is likely lower despite the potential for a short-term rally as shown in the daily chart above.
I realize this is a bit confusing, but this is the nature of the markets. For executing a 'buy' or 'sell' of an asset in the market, I like to use daily analysis to determine the "timing" of the transaction.
However, from a portfolio management perspective, I am a long-term investor. Therefore, I need to understand the intermediate to longer-term trends of asset prices. As long as prices are trending positively, I want to remain invested despite potential short-term volatility that may exist. When asset prices began to trend negatively, I do not want to be heavily tilted towards risk.
Currently, despite all of the volatility since last May, the markets have not fully changed their trend from positive to negative. Not yet, anyway.
The weekly chart below shows the market versus a one-year and two-year moving average. Currently, the 1-year moving average is just 1-point shy of crossing below the 2-year moving average. Historically, this has only occurred at the peak of the last two bull markets and represents the trend change process.
The bottom part of the graph is a moving-average convergence divergence indicator (MACD) which acts an an early warning sign that risk should be reduced in portfolios. That signal was registered in May, 2015 which is when I reduced equity risk in portfolios by 50%.
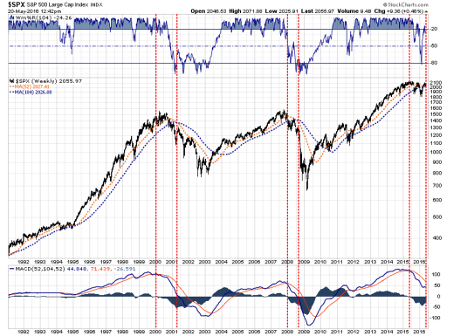
Furthermore, if we step back even further and look at a monthly chart, we see more signs of ongoing deterioration currently. As shown below, there are many measures of the market currently issuing warning signs.
These warning signs should not be readily dismissed against a very short-term advance in the market. The longer-term dynamics act like gravity against extremely short-term, headline driven price volatility.
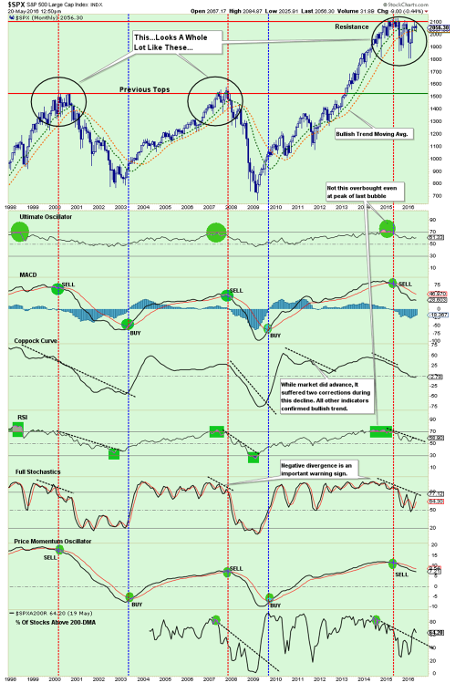
While the market is currently holding support, keeping current allocations in place, the "gravity" of longer term price dynamics are dragging markets down to earth. But this is the normal process of a market top in progress. As the old saying goes:
"Bull markets die with a whimper, not with a bang." - Unknown
This article is for information and discussion purposes only and does not form a recommendation to invest or otherwise. The value of an investment may fall. The investments referred to in this article may not be suitable for all investors, and if in doubt, an investor should seek advice from a qualified investment adviser.
Lance Roberts is a Chief Portfolio Strategist/Economist for Clarity Financial. He is also the host of "The Lance Roberts Show" and Chief Editor of the "Real Investment Advice" website and author of The "Real Investment Daily" blog and the "Real Investment Report". Follow Lance on Facebook, Twitter and Linked-In