4 extreme financial charts
23rd May 2016 16:33
by Lee Wild from interactive investor
Share on
It's been seven years since European stockmarkets bottomed out following the financial crisis. Despite the odd blip - check out 2011 - the bull market has remained intact. Economic activity has picked up, sure, but the impact of cost-cutting on a massive scale cannot be underestimated.
Eurozone GDP grew at 0.5% in the first quarter of 2016, its fastest pace in a year, but data shows business was much harder for our major trading partner in May.
Exactly a month before the EU referendum, we hear the eurozone composite purchasing managers' index (PMI) - a measure of both services and manufacturing activity - fell to a 16-month low last month. The preliminary, or "flash" read, came in at 52.9, down a touch from 53 in April and weaker than the 53.2 consensus. A read of over 50 indicates growth.
"Details of both sectors suggest that momentum is unlikely to strengthen in June, with weaker external demand weighing on manufacturing new orders, and services new business dipping to a 16-month low," warn economists at Barclays.
Over at rival broker UBS, the team of strategists is wincing at four charts at 40-year highs, which they believe confirm that Europe remains distressed.
There are two possible explanations, according to UBS. The first is that Europe is structurally broken. If correct, and record sales of European ETFs suggests many think this is the case, reform will take years.
However, if you believe, like UBS, that the drivers of the decade-long three-legged crisis - banks, sovereign crisis and emerging market and commodity slowdown - are less potent, then things could be looking up.
Chart 1: Bund vs Bank yield gap at 40-year high

The gap between the yield on offer on 10-year Bunds and the European Banks dividend yield is near 6%, a 40-year high. But the banking sector price/earnings (PE) ratio is back at 2009 levels, despite capital levels four times higher than pre-financial crisis.
"Any change in the inflation outlook should favour the Banks (which could use a little more inflation), not the Bunds," thinks UBS.
Chart 2: European Profits: slowest lane in 43 years
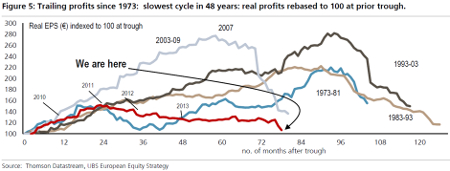
A slump in commodity prices hit first-quarter profits and makes the chart above look pretty ugly (see red line).
"With commodity prices and inflation finally starting to return, have expectations perhaps become too bearish?" asks UBS.
Chart 3: Performance lag to US biggest in 42 years
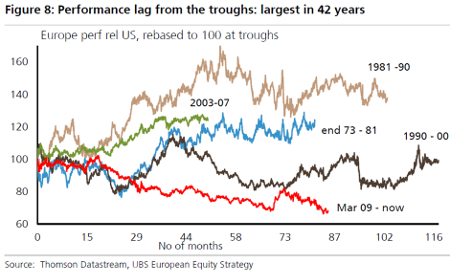
Europe typically lags the US coming out of recession, but this is the weakest since 1973!
"At a minimum it does look like we have paid back much of the 'good times' of the prior boom," UBS writes. "We think it is time for at least a partial catch-up as the potency of the three-legged crisis subsides."
Chart 4: Valuation gap to US biggest since 1983
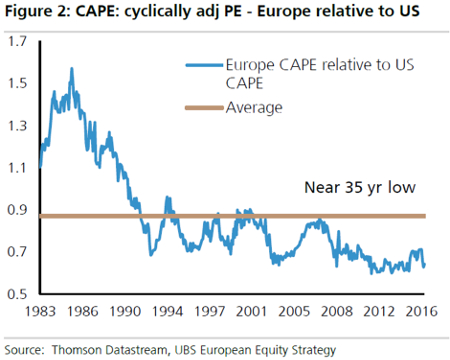
All the stops the European cyclically adjusted PE (CAPE) hitting a 40-year low is a lack of data going back far enough. CAPE is today's price over 10-year average earnings for both markets, so we need 50 years of data. Still, it's at a near-35-year low.
"This valuation gap is even more unusual because European profits disappointed for the past 9 out of 10 years which leaves Europe with no profit growth in a decade," says UBS.
"The contrast between no earnings per share growth in Europe and the US recently hitting record profits, should have reduced the valuation gap by pushing Europe's relative PE higher (from depressed earnings). If Europe can resume any sort of profit growth from here, it will challenge the chart [above]."
UBS conclusion:
You have to decide whether the charts above present an opportunity or further reason to run from European equities. For decades Europe has lagged the US structurally so there is nothing new there. What we see in this note is something that goes beyond that, in our view.
After the latest rounds of QE and a pretty poor first-quarter earnings season, investors decided to leave Europe, if the recent ETF flows are anything to go by. This presents an opportunity in our view.
This article is for information and discussion purposes only and does not form a recommendation to invest or otherwise. The value of an investment may fall. The investments referred to in this article may not be suitable for all investors, and if in doubt, an investor should seek advice from a qualified investment adviser