Should this rally embolden investors?
31st May 2016 11:02
by Lance Roberts from ii contributor
Share on
Head & shoulders put to rest…for now
A couple of weeks ago I discussed the rather clear "head and shoulders" technical pattern that was developing in the market. These patterns often suggest deeper corrections if they complete by breaking neckline support. A "grey rhino" if there ever was one.
The good news is that the rally this past week terminated that formation by breaking the very short-term downtrend line as shown below.
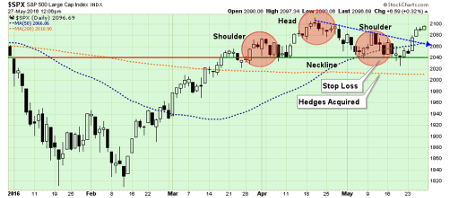
While the market did nullify the more bearish short-term pattern, it is important to note that the market has not done much more than that.
All that really happened last week, as shown in the chart below, was an oversold bounce on deteriorating volume, confined to an overall market downtrend.
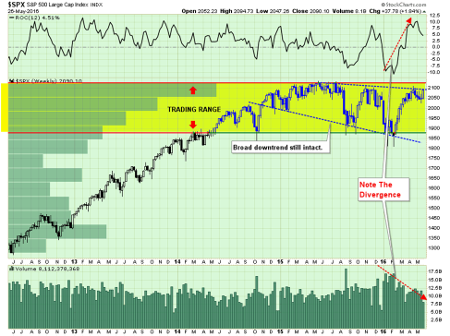
This isn't a rally that should embolden investors to take on more risk, but rather considering "selling into it" as we head into the seasonally weak period of the year.
But that's just me.
One note, though. The markets have not made a new high within the past year. What does history suggest happens next? 77% of the time it has evolved into a bear market.
On second thought, maybe that should be you too.
"In the short run, the market is a voting machine, but in the long run it is a weighing machine." Benjamin Graham
The Monday morning call
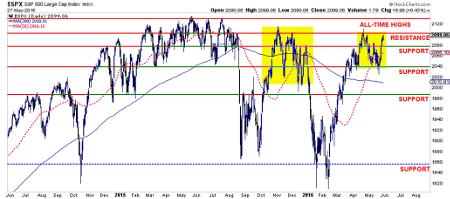
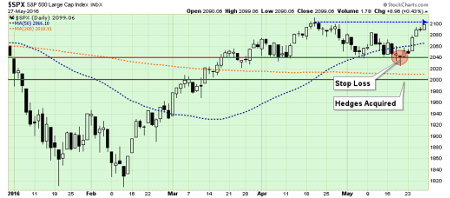
Despite the litany of longer-term fundamental and economic issues that stalk the markets, the short term technical dynamics for traders still remain bullish-biased. As shown in the chart below, the markets defended important support at 2,040 last week and rallied back to recent highs.
However, this rather "spiky" move in the market last week, as shown above, has become quite commonplace since the beginning of last year. Such spikes in activity have been more opportune for "sellers" rather than "buyers."
Furthermore, as I have been detailing over the last couple of weeks, the current price action remains very similar to that seen last November.
While I am not "certain" the outcome will be the same, given that we are moving into a more "seasonally weak" period of the year, a potential Fed rate hike like last December, and a political election cycle; there are certainly enough things to worry about.
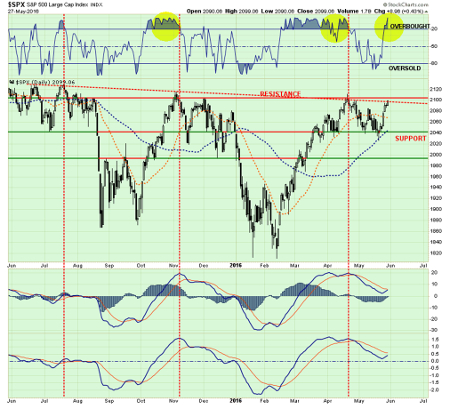
With the market back to overbought conditions and pushing on important resistance at 2,100, it will be critical for the markets to advance next week above 2,100. A failure to do so will likely lead to a re-test of the 2,040 level, a break of which would signal a deeper decline in progress.
Stops & Hedges
I am leaving my stops in place this week at the current support level of 2,040, as shown above.
Furthermore, as stated previously, I have also positioned a short-market hedge in portfolios to reduce to overall allocation to market neutral in the event the market breaks 2,000. I am leaving that trigger level in place this week, as a breach of such level would be a violation of both the 200-day moving average (DMA, currently at 2,010) and the psychological support levels of 2,000.
While there are many reasons to move the hedging level higher this week, given the price volatility over the last several months keeping the current level should reduce the potential for a "whipsaw" to occur.
This article is for information and discussion purposes only and does not form a recommendation to invest or otherwise. The value of an investment may fall. The investments referred to in this article may not be suitable for all investors, and if in doubt, an investor should seek advice from a qualified investment adviser.
Lance Roberts is a Chief Portfolio Strategist/Economist for Clarity Financial. He is also the host of "The Lance Roberts Show" and Chief Editor of the "Real Investment Advice" website and author of The "Real Investment Daily" blog and the "Real Investment Report". Follow Lance on Facebook, Twitter and Linked-In