Chart of the week: Next move is up
11th July 2016 12:39
by John Burford from interactive investor
Share on
Can M&S get up off the floor?
Poor old can't seem to catch a break. Just as with (see next section) last December, can any sane person possibly make a case for buying these bombed-out shares with all of the well-known problems in the retail sector? Sane or not, I will try.
In what must go down as one of the most embarrassing corporate blunders of the year, last week's quarterly sales figures - which were dismal anyway - had to be hurriedly pulled, only to be replaced with even worse numbers!
But what really caught my eye was the market reaction - after an initial mark-down, the shares rallied hard to finish the week well up from the lows. There was major buying support at current levels.
To me, that is a vital clue that the trend is most likely now up - and last week's blunder probably marks an extreme high in bearish sentiment.
Also, conventional thinking has it that the Brexit plunge in sterling will hit their margins, as the company buys its products from abroad. In fact, when the vote result was announced, the shares were hit for six. But the 260p low that day hasn't been breached since, even when last week's sales blunder came to light.
Here is the weekly chart:
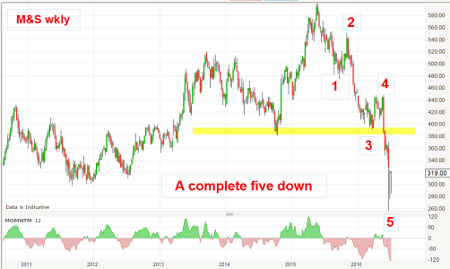
The £6 high last year marked the top and the massive decline off it has a lovely five-down impulsive pattern. Both waves two and four (counter-trend) are three-ups and wave three turned right at the chart support (marked in yellow) at the 380-400p area.
And wave five has terminated in a spike at the 260p low made on 24 June, the first trading day after Brexit. According to Elliott wave theory, when an impulsive five-wave pattern has completed, the next move is a counter-trend move, usually in an A-B-C form. For M&S, that means up.
Here is the daily chart showing recent action:
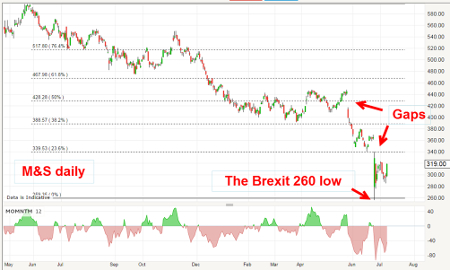
There has been much damage to the chart from Brexit and all of the other company-specific hits, but it appears that any further "bearish" news - if any materialises - should be well contained.
There are two magnets - the gaps at the 340p and the 420p levels. Will they be filled?
BHP Billiton approaches crucial £10 level again
In January, I started getting interested in this share because sentiment was off-the-scale bearish and the share price was plunging. As I pointed out then, this can be a terrific launchpad scenario for a "surprise" counter-trend rally of some size.
On 9 March, I noted that my first target at £10 had been achieved a few days earlier and that a pullback was due. In fact, the market duly obliged and retreated to the £8 region. But since then, one of its major products - iron ore - staged a healthy rally that completely surprised many pundits.
With steel in massive over-supply from Chinese foundries who were flooding the world markets, driving prices to extreme low levels, why would iron ore prices go against what is considered by most to be a solid bear trend?
The Tata steel works in the UK were shut down ostensibly because of being unable to compete against the cheap Chinese products. This was all over the mainstream media headlines - and probably marked the extreme low in bullish sentiment.
But that is the beauty of markets - they usually do the unexpected when most are looking the other way!
Here is the chart of iron ore prices, which show a stunning 80% rally off the December lows.
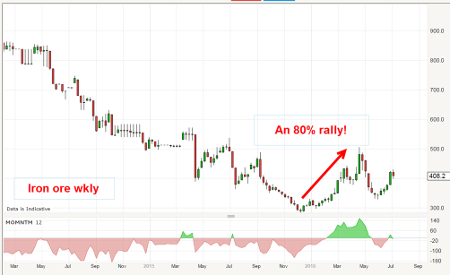
The rally doesn't look much set against the huge fall from the 2014 highs, but an 80% gain in a few months caught a lot of people napping - and allowed canny bargain-hunters to pick up cheap BHP shares. Here is the weekly share chart:
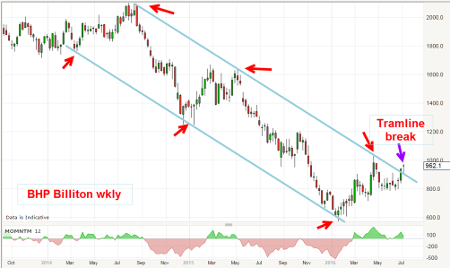
The historic decline off the 2014 highs is well-contained inside the trading channel described by my blue tramlines. Each tramline sports three accurate touch points (red arrows) and on Friday, the market managed to punch up past the upper tramline in a bullish display.
The immediate trend is up, but the longer-term outlook is not so bullish as this is a bear market rally. It is not a share to tuck away for years, but a trading vehicle.
This article is for information and discussion purposes only and does not form a recommendation to invest or otherwise. The value of an investment may fall. The investments referred to in this article may not be suitable for all investors, and if in doubt, an investor should seek advice from a qualified investment adviser.
These articles are provided for information purposes only. Occasionally, an opinion about whether to buy or sell a specific investment may be provided by third parties. The content is not intended to be a personal recommendation to buy or sell any financial instrument or product, or to adopt any investment strategy as it is not provided based on an assessment of your investing knowledge and experience, your financial situation or your investment objectives. The value of your investments, and the income derived from them, may go down as well as up. You may not get back all the money that you invest. The investments referred to in this article may not be suitable for all investors, and if in doubt, an investor should seek advice from a qualified investment adviser.
Full performance can be found on the company or index summary page on the interactive investor website. Simply click on the company's or index name highlighted in the article.
Disclosure
We use a combination of fundamental and technical analysis in forming our view as to the valuation and prospects of an investment. Where relevant we have set out those particular matters we think are important in the above article, but further detail can be found here.
Please note that our article on this investment should not be considered to be a regular publication.
Details of all recommendations issued by ii during the previous 12-month period can be found here.
ii adheres to a strict code of conduct. Contributors may hold shares or have other interests in companies included in these portfolios, which could create a conflict of interests. Contributors intending to write about any financial instruments in which they have an interest are required to disclose such interest to ii and in the article itself. ii will at all times consider whether such interest impairs the objectivity of the recommendation.
In addition, individuals involved in the production of investment articles are subject to a personal account dealing restriction, which prevents them from placing a transaction in the specified instrument(s) for a period before and for five working days after such publication. This is to avoid personal interests conflicting with the interests of the recipients of those investment articles.