Which way will the market break out?
12th October 2016 10:54
by Lance Roberts from ii contributor
Share on
Market decision nears
A major decision point is rapidly approaching which will decide the fate of the market for the rest of the year.
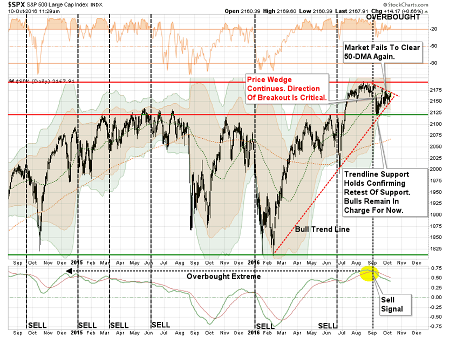
In the daily price chart below, the tightening consolidation of the market is evident.
Notice in the bottom part of the chart the market currently remains on a 'sell' signal. That 'sell' signal is problematic for two reasons:
1) "'Sell' signals" combined with overbought conditions tend to lead to at least short-term corrections.
2) "'Sell' signals formed at very high levels, such as currently, suggest limited upside and larger correction probabilities.
Let's zoom in on the recent price action in the chart above. The chart below is the last three months of daily price movement. As you will see, while prices have been quite volatile, there has been virtually no progress in the market during the period.

The two dashed lines show the tightening consolidation pattern more clearly. With the pattern becoming much more compressed, it is quite likely a breakout is going to occur within the next few days. The direction of that breakout will be most important.
As I wrote last Tuesday, a breakout to the upside would likely see a push of the markets towards the targeted level of 2,400. However, such a move would also require a real improvement in economic growth and earnings to remain supportive of those valuations. Otherwise, the move will likely be very short-lived.
"A move to 2,400 would once again stretch the limits of deviation from the long-term trend line, likely leading to a rather nasty reversion shortly thereafter."

Conversely, a break to the downside would likely signal a deeper correction in the works, which would be consistent with failed expectations of stronger earnings and economic growth, a strong dollar, weaker commodity prices and lower interest rates. These retracement levels are shown below.
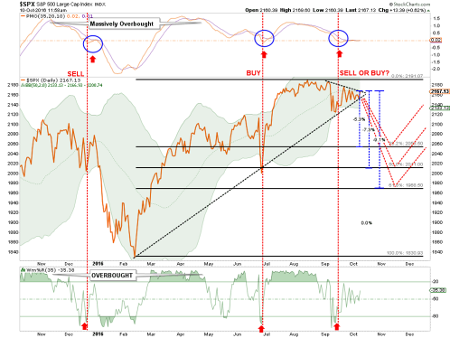
I have not only denoted the standard Fibonacci retracement levels, but also the depth of the correction associated with each. Importantly, from current levels, the deepest currently expected correction in the short-term would only be 9.1%.
While this doesn't even register on the scale of a "significant" correction, given the length of time without a 10%-plus correction it will likely "feel" far worse than it actually is.
Importantly, a breakdown in the markets from current levels will have two negative short-term consequences:
1. The market will provide a negative return year to investors which, for those depending on compounding returns at 6% annually, set back retirement goals.
2. The "breakout" to new market highs will be nullified as the market returns to its trading range that began in May of last year.
However, on a longer-term basis, the breakdown would also violate very important bullish trend lines which would denote a significant change in market trends.
As shown in the chart below, the "megaphone" topping process, combined with weekly long-term sell signals, still remains. A downside correction that breaks the bullish trend line from the 2009 lows would suggest a broader reversion in the works.

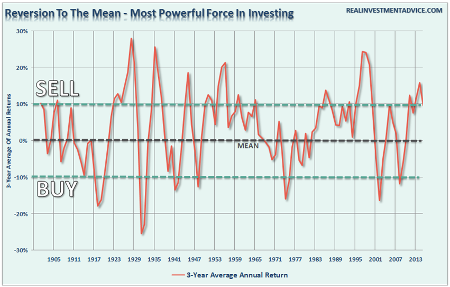
Once again applying a standard Fibonacci retracement to the current cyclical bull market, we find the next "bear market" could range from 26.1% to 42.7%. Given the current extension of valuations, debt and leverage levels, and weak sales growth, a recessionary correction between 34.4% and 42.7% would not be extraordinary.
As stated, a correction of this magnitude would not be unprecedented and would coincide with the onset of the next recession. But therein lies the problem.
Elena Holodny recently penned the following note from a UBS team led by strategist Julian Emanuel:
"It is worth noting that no US equity bear market of the last 25 years has begun without a recession starting within 12 months following the market top."
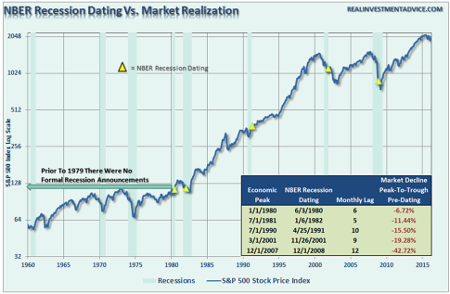
Unfortunately, that is not exactly an accurate statement. As I noted previously in Think Like A Bear, Invest Like A Bull:
"However, the 'lead effect' is much more coincident in reality. This is due to the fact that recessions are only revealed in hindsight once data is revised lower. This lag effect of the data revisions in shown below."
Which way is the market going to break?
I have no clue. And neither do you.
However, focusing my attention to a breakout to the upside, with portfolios already exposed to equities, is of little concern. It is the risk of a break to the downside that poses the most danger.
The current cyclical bull market is not over as of yet. Momentum-driven markets are hard to kill in the latter stages, particularly as exuberance builds. However, they do eventually end. That is, unless the Fed has truly figured out a way to repeal economic and business cycles altogether.
As we enter into the eighth year of economic expansion, we are likely closer to the next contraction than not. This is particularly the case as the Federal Reserve continues to build a bigger economic void in the future by pulling forward consumption through its monetary policies.
Will the market likely be higher a decade from now? A case can certainly be made in that regard. However, if interest rates or inflation rises sharply, the economy moves through a normal recessionary cycle, or if Jack Bogle is right,then things could be much more disappointing.
As Seth Klarman from Baupost Capital once stated:
Can we say when it will end? No. Can we say that it will end? Yes. And when it ends and the trend reverses, here is what we can say for sure. Few will be ready. Few will be prepared.
We saw much of the same mainstream analysis at the peak of the markets in 1999 and 2007. New valuation metrics, IPOs of negligible companies, valuation dismissals as "this time was different," and a building exuberance were all common themes. Unfortunately, the outcomes were always the same.
"History repeats itself all the time on Wall Street" - Edwin Lefevre
This article is for information and discussion purposes only and does not form a recommendation to invest or otherwise. The value of an investment may fall. The investments referred to in this article may not be suitable for all investors, and if in doubt, an investor should seek advice from a qualified investment adviser.
Lance Roberts is a Chief Portfolio Strategist/Economist for Clarity Financial. He is also the host of "The Lance Roberts Show" and Chief Editor of the "Real Investment Advice" website and author of The "Real Investment Daily" blog and the "Real Investment Report". Follow Lance on Facebook, Twitter and Linked-In