A stock in one chart: Next a bargain?
3rd November 2016 13:39
by Phil Oakley from ii contributor
Share on
Former City analyst Phil Oakley believes the fortunes of many companies can be summed up in a single financial chart. This week it's .
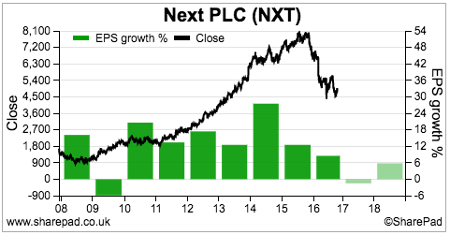
Next shares have endured a torrid 2016 following a stellar rise over the preceding five years.
For some time, the company was able to stand out from a crowd of struggling high street retailers by delivering impressive rates of profits growth. Its Directory business was its star performer and allowed the company to get round the challenges of operating from bricks and mortar stores. Profits growth was then turbocharged by the clever use of share buybacks that were financed by the company's impressive cash flow.
Now, the company is finding life a lot tougher. The Directory business has stopped growing and so have Next's profits. It is also having to sell more clothes on sale in order to shift its stocks rather than more profitable full priced sales.
Investors seem relieved that Next has maintained its pre-tax profit guidance of £805 million for the year, but this is being driven by cost cutting which is not sustainable. If sales don't see a sustainable pick up then analysts forecasts for 2017/18 might be too high.
If Next can recover, then its shares, which are currently trading for just less than 11 times 2016/17 earnings, could be a bargain. But without growth it's difficult to see a rapid bounceback in the share price.
The ii view:
Next's third-quarter results were underwhelming. Both full-price sales and the Directory business did worse than expected, and the mid-point on previous sales guidance is nudged lower.
Admittedly, October went well, year-on-year comparatives get easier, and there was better news on costs. Top line growth, however, remains a problem, and the dividend is currently tipped to grow much faster than profits.
As always with Next and the fashion retailers, the weather can make or break a set of results. Pray for a cold snap this winter.
Read more from Phil Oakley here. Financial charts are a feature of SharePad, the web-based service from ShareScope. Voted UK's Best Investment Software 2015. For a limited period, you can get a three month subscription to SharePad for just £25.
This article is for information and discussion purposes only and does not form a recommendation to invest or otherwise. The value of an investment may fall. The investments referred to in this article may not be suitable for all investors, and if in doubt, an investor should seek advice from a qualified investment adviser.