How FTSE 100 can escape 500-point plunge
2nd May 2017 10:34
by Alistair Strang from Trends and Targets
Share on
The FTSE this week (FTSE:UKX)
Up here in Argyll, the bluebells are out and the sun is (thankfully) burning the lawn. As a result, we're full of the joys of summer. Unlike the , which continues to make a poor showing for any recovery.
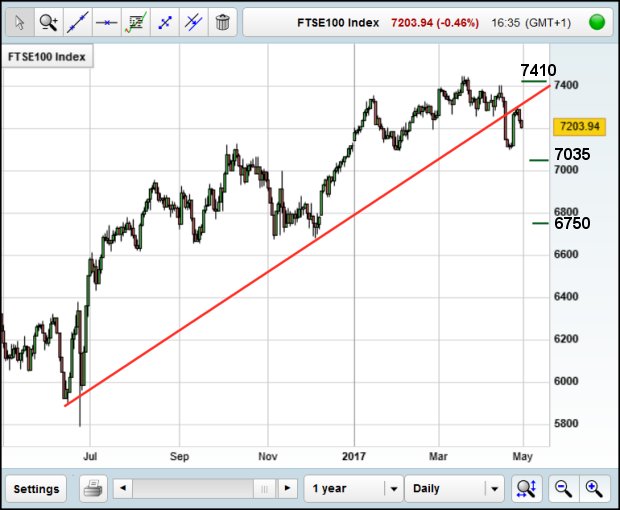
We'd started last week pointing out the index is trading in a region where a bottom of 6,750 is possible with the market now needing above 7,356 to escape such grotty potentials.
Even above 7,285 would better the immediate downtrend, giving the beginning of hope - but we'd not advise holding one's breath.
About the only residual hope remaining is the market 'should' have bottomed around 7,075 last week, but the lowest achieved was a sniffle below 7,100 points. Perhaps this implies some hidden strength in the marketplace.
We'll pretend optimism and suggest anything now above 7,285 should provoke an initial 7,320 points - still leaving the market in dangerous territory.
But if 7,320 is now bettered, then growth toward 7,410 and safety becomes possible. If triggered, the tightest stop comes in at 7,257 points, but in an election week there are almost certain to be wide swings.
The alternative now would be below 7,155 points at 7,094 initially with secondary, if broken, at 7,035 points. But it must be remembered, in the event of the index moving below 7,094, it is firmly in the grasp of 6,750 in the future.
Finally, with UK local elections this coming Thursday, will political opponents be greeting each other with the endearment, "May the 4th be with you"? And why is that Star Wars cliché not polluting some newspaper headline?
Barclays and RBS (LSE:BARC and LSE:RBS)
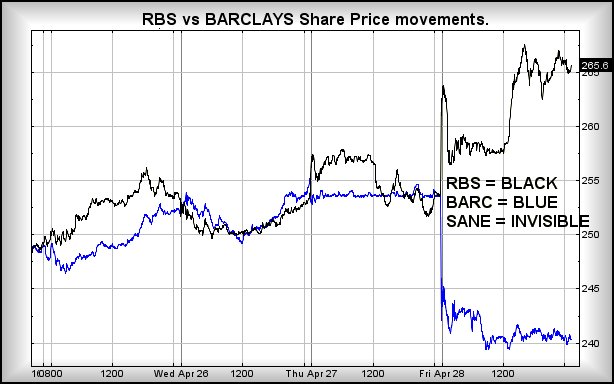
When we refer to the retail banking sector as the 'clown' sector, it's because we've grown to expect such utter nonsense as occurred on Friday 28 April, with and share price.
For a while, the synchronicity of RBS being up 5.2% while BARC moved down 5.2% was funny. Then it became the stuff of ridicule, and finally irritation.
Really, how are we supposed to believe in a free amd fair marketplace with this sort of utterly random silliness going on?
The amusement generated by the amazing co-incidence of RBS and Barclays mirroring each other's intraday movements reminded us sharply of a UK market often appearing beyond the reaches of sanity, yet sadly complaining about the current lack of private investors compared to the 'good old days'.
The chart below, giving minute-by-minute movements on the two shares, tells its own story, though there is something important worthy of comment.
When viewing Barclays' price movements on the 27th (it effectively did nothing), we are reminded of the adage "if it ain't goin' up, it's goin' down".
Earlier, Barclays had indeed triggered the potential for upward movement, assiduously avoiding the nirvana of 'higher highs' in the period thereafter. With 20:20 hindsight, we should have red flagged this, in addition to warning clients it needed better than 226p to be taken seriously.
Finally, a reminder: The scaling on this chart is for RBS's share price, not Barclays, despite their near-similarity.
This article is for information and discussion purposes only and does not form a recommendation to invest or otherwise. The value of an investment may fall. The investments referred to in this article may not be suitable for all investors, and if in doubt, an investor should seek advice from a qualified investment adviser.
Alistair Strang has led high-profile and "top secret" software projects since the late 1970s and won the original John Logie Baird Award for inventors and innovators. After the financial crash, he wanted to know "how it worked" with a view to mimicking existing trading formulas and predicting what was coming next. His results speak for themselves as he continually refines the methodology.