A breakout at Barclays could be imminent
9th August 2017 10:25
by Alistair Strang from Trends and Targets
Share on
Barclays (LSE:BARC)
Opting to swap an office chair for a large red exercise ball provided an entirely new perspective when looking for bounce points on shares! It also made Jo Whiley's evening Radio 2 show fraught with danger, due to her choice of multiple Blur tracks. Let's just say, when you can bounce, you bounce. Exercise without effort.
And this brings neatly into the frame.
It's not bouncing, but then again, it's not dropping either. Instead, it's behaving as if the price were sitting on a bouncy ball while listening to Radio 4...
We've drawn a plethora of lines on the chart in an attempt to confuse the issue. The dashed red and blue lines represent the real up-trend and down-trends, the solid red and blue lines represent what has happened since each trend break occurred. Additionally, we've painted a couple of circles at the points of trend break.
It cannot be stressed sufficiently this isn't 'technical gibberish', but instead an attempt to inject some common sense into market movements since April.
The two circled areas tell us Barclays' share price broke its ruling uptrend at 220p, then exceeded its ruling downtrend at 207p. Given the net effect was 13p, we regard the share price as effectively flatlining and not worthy of any immediate attention.
Instead, we need use the pretty picture to define the point we'd be comfortable deciding the Barclays price is actually about to show direction with integrity.
By drawing a couple of solid red and blue lines, we discover the share price currently needs below 'red' - 200p - to suggest panic or above 'blue' - 213p - to suggest undiluted optimism.
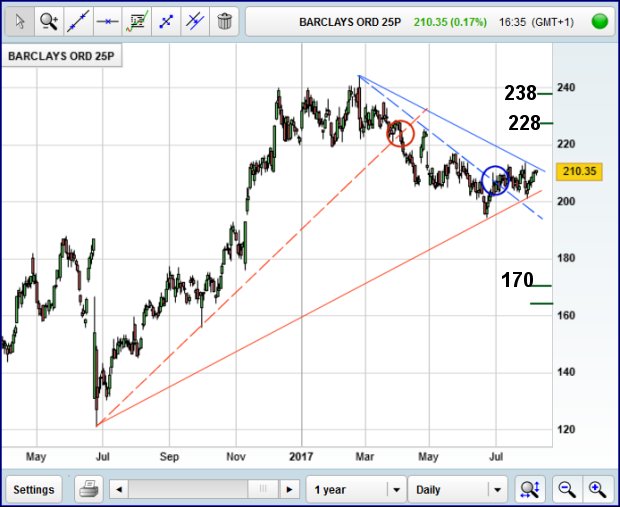
Our preference when a share is proving stodgy such as Barclays is to insist we see the price actually close above (or below) a trend. In other words, if Barclays manages to close above 213p, or trades intraday above 214p, the last high, we'd be confident it is about to head to 228p initially with secondary a rather more useful 238p.
On the down side, a break below 200p would prove alarming, stuffing the share into a region where 170p becomes very possible as a bounce point. If 170 should break, we'd almost insist the share exhibit some bounce potential by 165 as the consequences below such a point are quite dreadful - potentially.
If trading this, either closure below 200p would justify alarm or alternately, intraday traffic below 194p.
For now, like the other retail banks, we find it difficult to express any confidence as to market direction and our usual rule, "if it ain't goin' up, it's goin' down" cannot safely be applied due to its behaviour against both "real" historical trends.

Alistair Strang has led high-profile and "top secret" software projects since the late 1970s and won the original John Logie Baird Award for inventors and innovators. After the financial crash, he wanted to know "how it worked" with a view to mimicking existing trading formulas and predicting what was coming next. His results speak for themselves as he continually refines the methodology.
Alistair Strang is a freelance contributor and not a direct employee of Interactive Investor. All correspondence is with Alistair Strang, who for these purposes is deemed a third-party supplier. Buying, selling and investing in shares is not without risk. Market and company movement will affect your performance and you may get back less than you invest. Neither Alistair Strang, Shareprice, or Interactive Investor will be responsible for any losses that may be incurred as a result of following a trading idea.
This article is for information and discussion purposes only and does not form a recommendation to invest or otherwise. The value of an investment may fall. The investments referred to in this article may not be suitable for all investors, and if in doubt, an investor should seek advice from a qualified investment adviser.