Do the math: Making a profitable arbitrage model is kids' stuff
10th August 2017 11:20
by Sam Brown from interactive investor
Share on
For many people maths is one of the worst and most confusing things in life. Having studied it for the past 10 years, I agree. But, unfortunately, it's also hugely important and relevant in nearly every aspect of life, especially finance. In sixth form, I was recently given the task of researching a maths project involving one of my interests - investing.
While others created projects on Poker odds and conditional probability, I went for a more exotic option. I decided to try and create a "simple" arbitrage model!
An arbitrage model highlights anomalous variations in the price between similar financial instruments. It enables you to simultaneously buy and sell securities, currencies or commodities based on signals generated by the model. It's a trading strategy that's spawned an entire industry worth many billions of dollars.
A "perfect" arbitrage generates free money without any risk. In the real world, however, there is always some downside risk, which means that there's always a danger of losing money, however smart you think you are.
For my model, I focussed on commodities and the companies which produce them, but in theory you can create a model for any sector, as long as you identify the right variables, those which display the greatest correlation.
Understanding what moves each sector is the real skill here. Yes, the maths can be tricky in places, but it's really just equations.
It's why I picked commodities because it's mocre obvious what moves share prices - precious metals. Banking, retail and airlines sectors have so many different price movers that, after weeks of studying them, I'm still clueless! So, if you have a detailed understanding of the markets and movement triggers, then great, but there must be a significant correlation.
I wanted to look at individual shares to determine how correlated the price was compared to changes in the cost of underlying commodities produced by those companies, and whether this could present any potential trading opportunities. It did!
Building the model
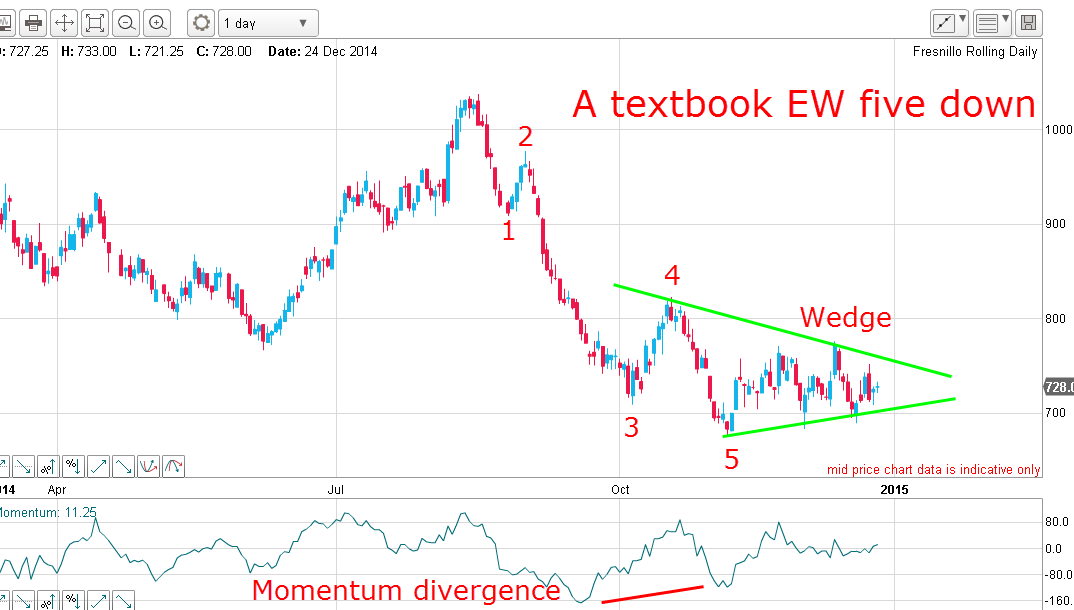
Looking at a range of different commodity shares, I picked for my model, as it is very clear what drives its share price. Fresnillo mines for gold and silver in Mexico, but also produces small amount of zinc and lead.
Unlike many other sectors where multiple factors influence share prices - that makes it hard to create a successful arbitrage model - Fresnillo generates over 90% of revenue from gold and silver, making it an obvious starting point.
In theory, if my model works and Fresnillo's share price moves below where it should be relative to the price of gold and silver, then I could potentially profit by simultaneously buying the shares and shorting precious metals. Conversely, I could short Fresnillo if the share price overshoots the underlying commodity prices in which I would take a long position.
The model won't take account of all the big macro themes entirely, nor does it factor in the impact of management or other potential intangibles, but it should still provide a way to identify moments of under or over-valuation.
In terms of the model itself, I began with a lot of data mining (finding a year's worth of daily prices for each metal and Fresnillo) and a massive excel spreadsheet. I found most of the historical data using Bloomberg and The London Bullion Market (LBMA), but other websites do the same.
The first step was to work out what percentage of Fresnillo's revenue came from each commodity it produced. From this I could build a composite index made from daily underlying commodity prices weighted according to Fresnillo's own output mix. In theory, this index should be the best price driver of Fresnillo's share price.
I then plotted my index against the Fresnillo share price to see how correlated they have been over the past year. To do this, I calculated the product moment correlation coefficient (PMCC) between the two sets of data.
This is a measure of how correlated two data series (Fresnillo's share price and my composite index) are - if one goes up, does the other one also go up and vice versa? The scale is -1 to 0 to +1, with -1 being perfect negative correlation (if one goes up, the other goes down), 0 being no correlation and 1 being perfect positive correlation (both go up or down together).
Hoping for a correlation as close to 1 as possible, I was disappointed to find the PMCC of my weighted composite index and Fresnillo shares was only 0.5384. That shows only limited correlation between the two and would make for a poor model.
Getting it right
Undeterred, I tried again, this time only using the gold price rather than any weighted composite. Bingo! To my pleasant surprise, there was a high positive correlation with gold, generating a PMCC of 0.8132.
Is it reasonable to choose a simple model with a higher statistical measure of correlation than a more "accurate" model with a lower degree of correlation?
That is a very good philosophical question, but I have little interest in philosophy, so am happy to choose gold as my main price driver because of the much higher correlation with the price of Fresnillo, which is what I was ultimately looking for.
The next stage in the process was to attempt a linear regression to predict the price that Fresnillo should be, given the price of gold in sterling. The linear regression is simply the straight-line relationship between an independent variable (here the gold price) and a dependent variable (Fresnillo's share price).
Comparing this predicted value to the actual price tells us when prices differed. The larger the difference the better because it indicates that either the price of one instrument is too high, or that the other one is too low. This provides your trading opportunities.
There are many complex factors to think about here to test whether the model is statistically accurate, but I won't bore you with the detail. Although my model was not perfect, it didn't breach any of the golden rules around regression testing, so we were good to go.
One final step before trading is to calculate the standard deviation of the errors. In this case it's called the standard error.
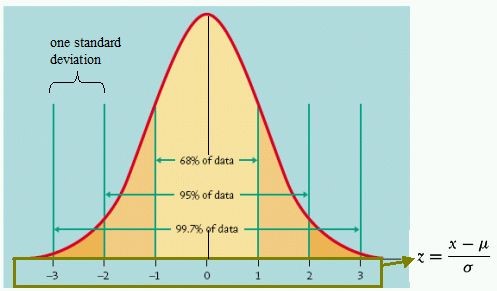
The standard error allows you to assess how far your dependent variable is from its expected value in a standardised form. If the error terms are truly normally distributed, your dependent variable should be within 1 standard error of its predicted value 68% of the time, and within 2 standard errors of its predicted value 95% of the time.
To determine trigger-points for my model, I looked at when the share price was more than 2 standard deviations away from where it theoretically should have been. We use 2 standard errors because 95% of the deviations are between -2 and 2 standard errors. When there is a point that is outside that, there is a very high likelihood that the price will fall or rise back into the 2 standard deviations range.
Back-testing, I looked at when the share price moved outside these limits and whether it would have provided good trading opportunities. The good news is, it would have done.
Did it work?
Buoyed by the theoretical success of my model, I ran it past my dad who has been professionally involved in investing for many years. Using my technique, he built a similar model for other stocks he was interested in.
It was a revelation, showing clearly that in some of his recent trades he had got in either too early or too late, and that he could have made much more money if he'd used my model to pick his entry and exit points. It's already adding value to his current trades. I should charge commission!
When you're trading there will always be some degree of risk, you can't avoid it. My model tries to reduce risk by trading at the most optimal times. I want to be 97.5% sure that I can make a profit on a trade if there are no unforeseen adverse events.
You trade this arbitrage model by shorting or buying gold vs Fresnillo when there is a greater than 2 or less than -2 standard error data point. You will short Fresnillo and buy gold when there is a standard error above 2, and buy Fresnillo and short gold below -2.
The graph below shows the predicted price created by the linear regression, plotted against the actual price. The two circled areas show where there was a greater than two standard deviation range and where the arbitrage would've taken place.
As you can see, if you had shorted Fresnillo during summer 2016, when there was a standard error greater than 2, you'd have made a big profit. Buying back in March this year would also have generated significant returns.
Obviously, there are other factors that will affect the prices of both instruments, so ideally there will be no other imminent economic or stock specific events likely to affect prices!
It is difficult, however, because many 2 standard deviation events naturally occur when things are happening. You will have to judge what's "noise" and what will really affect the value of your chosen investment.
Admittedly, this strategy requires both some understanding of maths and a significant amount of time to get right. However, my research proves that arbitrage models can identify real trading opportunities, which might help both reduce risk and generate extra trading profit by dealing at optimal times.
This article is for information and discussion purposes only and does not form a recommendation to invest or otherwise. The value of an investment may fall. The investments referred to in this article may not be suitable for all investors, and if in doubt, an investor should seek advice from a qualified investment adviser.