Here's how far FTSE 100 may fall
15th September 2017 00:14
by Alistair Strang from Trends and Targets
Share on
FTSE for Friday (FTSE:UKX)
Written: 15th September at 00:14
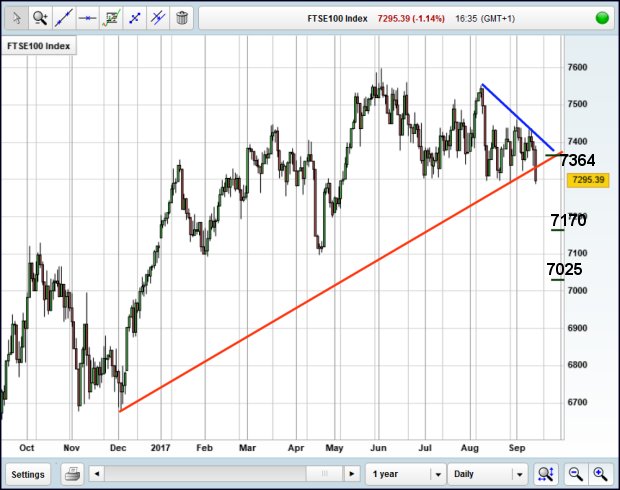
The is showing every sign of immediate chaos, closing on 14th September below the critical 7,300 level and, therefore, firmly emplaced in a region where weakness toward 7,025 makes perfect sense, perhaps with a bounce around 7,170 points.
As this implies the FTSE toddling off in a different direction from everyone else, we're a bit concerned. Or maybe it's leading the pack!
Recent months have been just a little boring and, while the downward trend break is obvious, almost painted in neon, we've seen some indications which in normal circumstance would tell us to ignore the drop.
One particular indicator has been "minute by minute" movements. We measure underlying strength in a market when normal logic is exceeded; ie, when a Long outperforms or a Short outperforms. In the case of the FTSE, Longs have tended meet and exceed initial targets whereas Shorts tend not to quite reach initial targets.
This sort of behaviour generally advises accurately which direction a trend break is liable to take. And in the current situation, with a currency whose strength is measured in chocolate frogs and an economy about to be murdered by Brexit (if we believe the media), our underlying mantra expecting an upward break has been feeling increasingly fragile.
We'll be stubborn first and try to measure the argument for near-term upward travel, and hope all the movements do not happen in the opening second on the 15th!
Rather uselessly, anything near-term above 7,318 is supposed to reach an initial 7,330 points. If triggered, stop can be at yesterday’s low of 7,286 points.
Crucially, if 7,330 is bettered, we shall take this as the first sign the market actually bottomed, stir the tea leaves again, and now promote 7,364 as a more interesting secondary destination.
Of course, the market actually needs better than 7,380 to escape the ruling force down to 7,025 points but the important thing to take away from the foregoing, aside from a potential 46-point rise, is we use this as a measurement of real market direction.
The other side to the misery is what happens if 7,286 is broken?
First, any short position tightest stop is at 7,380 currently, unpleasantly wide. But if 7,286, a magnificent drop toward a near term 7,270 makes some sense. But, if 7,270 breaks, a cycle toward 7,185 makes sense and tends to justify the silly stop loss level.
A small caveat of expecting a stumble downward around 7,255 makes sense.

Alistair Strang has led high-profile and "top secret" software projects since the late 1970s and won the original John Logie Baird Award for inventors and innovators. After the financial crash, he wanted to know "how it worked" with a view to mimicking existing trading formulas and predicting what was coming next. His results speak for themselves as he continually refines the methodology.
Alistair Strang is a freelance contributor and not a direct employee of Interactive Investor. All correspondence is with Alistair Strang, who for these purposes is deemed a third-party supplier. Buying, selling and investing in shares is not without risk. Market and company movement will affect your performance and you may get back less than you invest. Neither Alistair Strang, Shareprice, or Interactive Investor will be responsible for any losses that may be incurred as a result of following a trading idea.
This article is for information and discussion purposes only and does not form a recommendation to invest or otherwise. The value of an investment may fall. The investments referred to in this article may not be suitable for all investors, and if in doubt, an investor should seek advice from a qualified investment adviser.