Here's how high supercharged FTSE 100 can go
30th April 2018 09:14
by Alistair Strang from Trends and Targets
Share on
Written 29 April 2018
The FTSE for the week ahead (FTSE:UKX)
The is similar to Rudd, Corbyn, Trump, even the Scottish Government in one important way. Despite a hostile media, always foretelling the worst, it continued to sail on regardless, ignoring all icebergs - both foreign and domestic! [stop press: now Rudd-less]
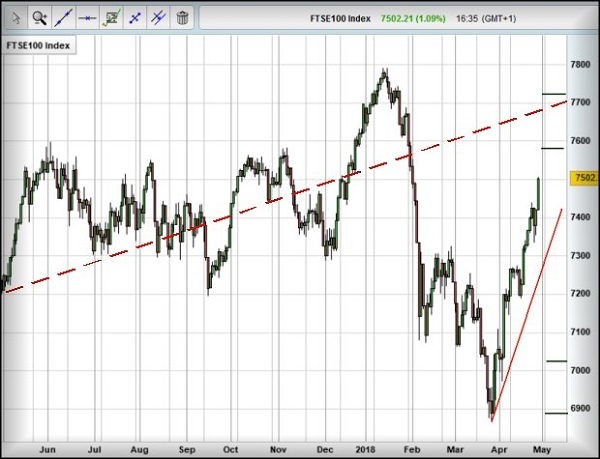
In the case of the FTSE, it's now regarded as on a course toward 7,578 points next. And should this level be exceeded, we are to cough politely and mention 7,718 points shall prove hard to avoid. Such has been the pace of recovery since the start of April the index needs only break red, currently 7,264, to suggest the pace of growth has eased.
But from an arithmetical perspective, the index actually needs below 7,160 before we'd be convinced it's actually going down!
Movement below 7,160 would truly prove a difficult pill to swallow, promising ongoing weakness to 7,025 points initially with secondary, if broken, at 6,870. Interestingly, this would present the potential of a "double bottom" on the market against the prior droop which hit 6,835 points.
While on the subject of visual appearances, our upper target at 7,718 does present a bit of a problem, longer term. As the chart shows with painful clarity, such an ambition is below the prior highs and therefore some turbulence can be anticipated at such a point.
Unfortunately, as always we can present a contra argument, one which is usually fairly reliable.
The Dashed Red line on the chart dates back to March 9th, 2009 and was the initial uptrend following the calamity of nearly 10 years ago. What piques our interest relates to shares and not the FTSE.
When a share price shows such irresolute behaviour against a primary trend, invariably the price will indeed continue upward.
In fact, when a share price regains a trend similar to this, acceleration picks up quite dramatically. Thus, our ambition of 7,718 is liable to prove rather interesting in the fullness of time.
Source: interactive investor Past performance is not a guide to future performance
Alistair Strang has led high-profile and "top secret" software projects since the late 1970s and won the original John Logie Baird Award for inventors and innovators. After the financial crash, he wanted to know "how it worked" with a view to mimicking existing trading formulas and predicting what was coming next. His results speak for themselves as he continually refines the methodology.
Alistair Strang is a freelance contributor and not a direct employee of Interactive Investor. All correspondence is with Alistair Strang, who for these purposes is deemed a third-party supplier. Buying, selling and investing in shares is not without risk. Market and company movement will affect your performance and you may get back less than you invest. Neither Alistair Strang, Shareprice, or Interactive Investor will be responsible for any losses that may be incurred as a result of following a trading idea.
Full performance can be found on the company or index summary page on the interactive investor website. Simply click on the company's or index name highlighted in the article.
These articles are provided for information purposes only. Occasionally, an opinion about whether to buy or sell a specific investment may be provided by third parties. The content is not intended to be a personal recommendation to buy or sell any financial instrument or product, or to adopt any investment strategy as it is not provided based on an assessment of your investing knowledge and experience, your financial situation or your investment objectives. The value of your investments, and the income derived from them, may go down as well as up. You may not get back all the money that you invest. The investments referred to in this article may not be suitable for all investors, and if in doubt, an investor should seek advice from a qualified investment adviser.
Full performance can be found on the company or index summary page on the interactive investor website. Simply click on the company's or index name highlighted in the article.