Chart of the week: Back this FTSE 100 winner
30th April 2018 11:42
by John Burford from interactive investor
Share on
On 24 December, I suggested that was a 'strong buy'. The shares were in a decline following the huge claims from the recent Caribbean hurricanes.
This was the chart then:
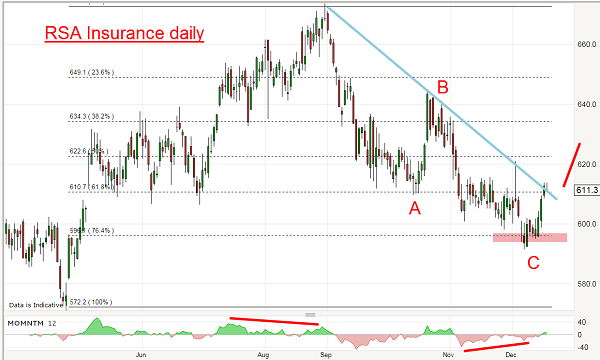
Source: interactive investor Past performance is not a guide to future performance
The setup was textbook. I had an A-B-C down off the late summer 672 high to the Fibonacci 76% support on a strong momentum divergence. Remember, three waves are always corrective to the main trend (up) and so this presents a classic 'buy the dip' setup (BTD) but with the critical advantage of great timing.
• Chart of the week: This blue-chip is a strong buy
Many investors/traders have used the BTD approach for years but with little regard to waiting for a high probability/low risk moment. Without such a scientific approach, you are often nursing a loss right off the bat by being too early (or too late).
Then, you are left wondering if the thing really will take off again or have you walked into a falling knife scenario? Not a good position to be in emotionally. And when you trade emotionally, you usually do the wrong thing.
I strongly advise looking for these low risk (tight stop) setups. If you are stopped out, so be it. You have taken a small planned and manageable loss and you can move on to planning another trade - perhaps in the same security. That is how professional traders operate (the ones you rarely or ever hear about).
So let's see how this trade is working out four months later - here is the updated chart
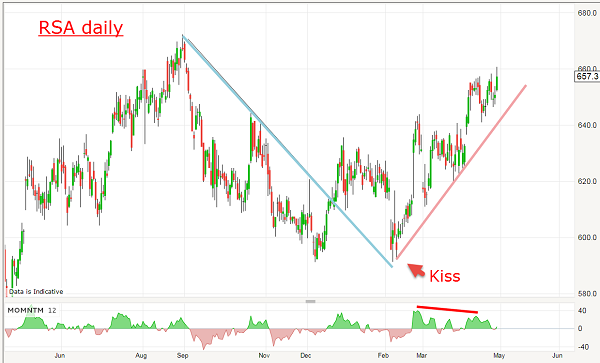
Source: interactive investor Past performance is not a guide to future performance
As the market broke clear of the blue trendline in late December, it entered a period of consolidation and then fell back again towards the old 590 low. This is always a moment of truth time.
I have found that many times in these situations, the market will fall back to test the old low and at the same time plant a kiss on the old trendline. Because the market has broken above it beforehand, it is now a line of potential support (was resistance before the break).
If the market plunged past the 590 area, the downtrend would still be in force, but if the kiss holds, the uptrend can resume. That knowledge is invaluable because you now have a line in the sand at the 590 area where stops can be set (just below).
In fact, the market observed that kiss and has resumed its upward journey. Now it has risen to a new high for the move at the 660 level. Does it still have legs?
I have drawn a pink trendline of support, but note the rally is losing momentum - a sign of caution.
I fear a break below this line could spell curtains for the rally and moving the stop up to the 640 area would be prudent. This is a 'moving stop' technique that captures a sure profit while allowing for further upside.
And with sterling weak, support just from currency considerations alone should persist and new high targets above 670 would heave into sight.
These articles are provided for information purposes only. Occasionally, an opinion about whether to buy or sell a specific investment may be provided by third parties. The content is not intended to be a personal recommendation to buy or sell any financial instrument or product, or to adopt any investment strategy as it is not provided based on an assessment of your investing knowledge and experience, your financial situation or your investment objectives. The value of your investments, and the income derived from them, may go down as well as up. You may not get back all the money that you invest. The investments referred to in this article may not be suitable for all investors, and if in doubt, an investor should seek advice from a qualified investment adviser.
Full performance can be found on the company or index summary page on the interactive investor website. Simply click on the company's or index name highlighted in the article.
Disclosure
We use a combination of fundamental and technical analysis in forming our view as to the valuation and prospects of an investment. Where relevant we have set out those particular matters we think are important in the above article, but further detail can be found here.
Please note that our article on this investment should not be considered to be a regular publication.
Details of all recommendations issued by ii during the previous 12-month period can be found here.
ii adheres to a strict code of conduct. Contributors may hold shares or have other interests in companies included in these portfolios, which could create a conflict of interests. Contributors intending to write about any financial instruments in which they have an interest are required to disclose such interest to ii and in the article itself. ii will at all times consider whether such interest impairs the objectivity of the recommendation.
In addition, individuals involved in the production of investment articles are subject to a personal account dealing restriction, which prevents them from placing a transaction in the specified instrument(s) for a period before and for five working days after such publication. This is to avoid personal interests conflicting with the interests of the recipients of those investment articles.