Will the FTSE 100 continue to break records?
21st May 2018 08:59
by Alistair Strang from Trends and Targets
Share on
Written 20 May 2018 22:42
Dow & FTSE markets for this week (FTSE:UKX)
This year, the Dow Jones experienced an "all time high" back in January. By an amazing co-incidence, the matched this accomplishment and in the period since, has even raised the bar.
The Dow hasn't. What does it all mean?
Regular readers will remember our 7,725 ambition for the FTSE, along with a suspicion the market could find it easy to better such a point, finding itself challenging prior highs.
Last week, it reached 7,791.4 points, virtually identical to January's 7,792 point pinnacle.
Perhaps more importantly, the FTSE did actually close the session on the 17th at 7,789 points, an all time high closing price.
To us, this is quite a big deal, meaning now above 7,792 and we'll anticipate 7,855 next with secondary, when bettered, at 7,990 points.
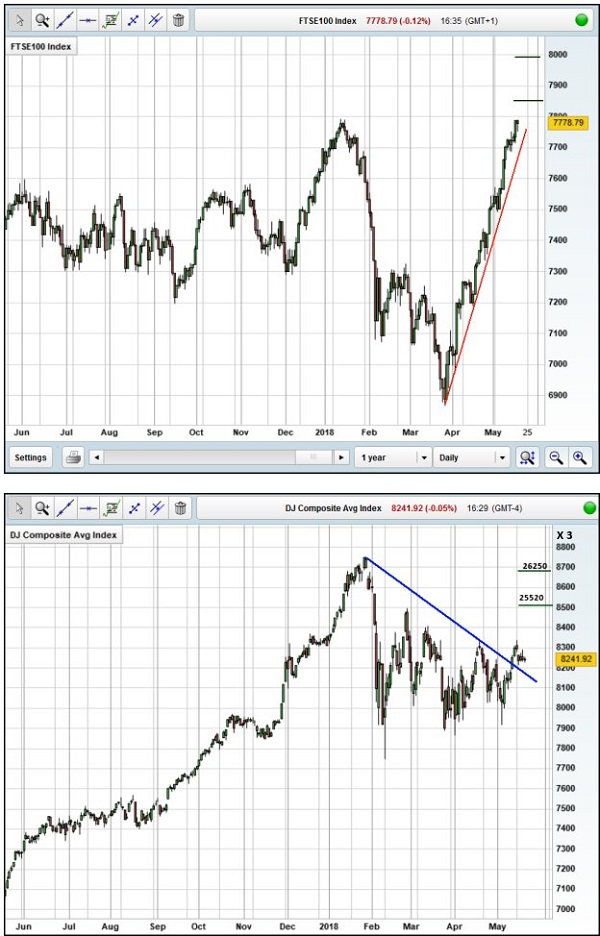
We're not entirely sold on the concept of further growth - just yet - as a heck of a lot of punters will view the chart below, assume "double top", collecting some profit in the process and doubtless allowing some sort of relaxation.
Balancing the threat of some negativity on the FTSE to 7,720 before we start raising eyebrows is the Dow Jones.
For some reason, Interactive Investor's chart provider gives scaling which requires multiplied by three before it makes sense.
However, the reality is the index need only better 25,000 points to commence a cycle to 25,520 next. And if bettered, secondary comes in at 26,250 points.
Interestingly, this will give - as near as soddit - the Dow Jones its own double top, meaning near term reversal on the FTSE is liable to be short lived until such time the Dow matches its own prior highs. At this point, some proper reversals will make sense, we think.
In summary, FTSE probably down a bit, simply due to "double top nerves". But conversely, we suspect the Dow is very liable to head up a bit. If our thoughts of a coming perfect storm prove correct, July and August are liable to prove interesting on the markets.
Source: interactive investor Past performance is not a guide to future performance
Alistair Strang has led high-profile and "top secret" software projects since the late 1970s and won the original John Logie Baird Award for inventors and innovators. After the financial crash, he wanted to know "how it worked" with a view to mimicking existing trading formulas and predicting what was coming next. His results speak for themselves as he continually refines the methodology.
Alistair Strang is a freelance contributor and not a direct employee of Interactive Investor. All correspondence is with Alistair Strang, who for these purposes is deemed a third-party supplier. Buying, selling and investing in shares is not without risk. Market and company movement will affect your performance and you may get back less than you invest. Neither Alistair Strang, Shareprice, or Interactive Investor will be responsible for any losses that may be incurred as a result of following a trading idea.
Full performance can be found on the company or index summary page on the interactive investor website. Simply click on the company's or index name highlighted in the article.
These articles are provided for information purposes only. Occasionally, an opinion about whether to buy or sell a specific investment may be provided by third parties. The content is not intended to be a personal recommendation to buy or sell any financial instrument or product, or to adopt any investment strategy as it is not provided based on an assessment of your investing knowledge and experience, your financial situation or your investment objectives. The value of your investments, and the income derived from them, may go down as well as up. You may not get back all the money that you invest. The investments referred to in this article may not be suitable for all investors, and if in doubt, an investor should seek advice from a qualified investment adviser.
Full performance can be found on the company or index summary page on the interactive investor website. Simply click on the company's or index name highlighted in the article.