Chart of the week: A terrific set-up for a trader
18th May 2015 12:11
by John Burford from interactive investor
Share on
By John C Burford, author of Tramline Trading, and Editor of MoneyWeek Trader
In these weekly articles, I will highlight a share that I believe has an interesting chart pattern. I am primarily a technical trader and use the methods I have developed that I call Tramline Trading. You can read more about my methods in my book Tramline Trading, which you can inspect here.
Most traders and investors make classic errors by chasing a stock near a top and then hang on to it too long during the decline. You will vastly improve your performance by timing your entries and exits more expertly - and that is what I hope to help you with.
My goal in these articles is to cover a share that has an interesting chart. I I developed my tramline system over several years to give me a set of rules which can provide me with trade entries at low risk. The low risk requirement was crucially important because no matter how firmly I believe in my trade, I could be wrong! And I wanted my wrong trades to hand me the smallest possible loss to my account. I figured the winners would take care of themselves.
My hope is that you glean useful ideas and employ at least some technical analysis to bolster your returns. In trading as well as investing, timing is a key factor in your eventual returns.
Pearson - an update
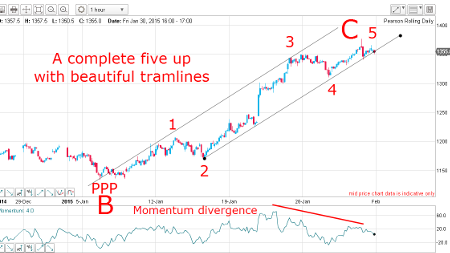
I covered the technical picture of on 2 February and concluded that if a short term tramline could be broken, then odds favoured a continued decline from the current levels. This was my hourly chart:
(click to enlarge)
The key level was the wave 4 low at 1,320p. So let's see if that level was breached:
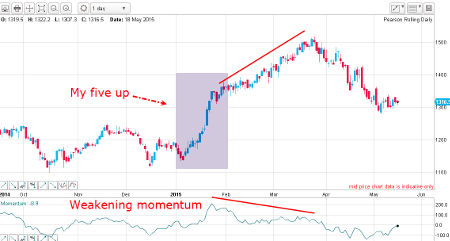
Here is the daily chart covering that January period:
(click to enlarge)
It is clear that my five up was not the end to the C wave rally - my lower tramline was not broken. And that is a lesson in waiting for a clear sell signal (broken tramline) to allow you to pull the trigger.
But with the weakening momentum, the rally high was put in late March and the market has dropped by 14% since then. My larger wave labels are proving to be correct, and rallies are likely to be good selling/shorting areas.
Carnival is cruising to a kiss
is the world's largest cruise company and it has been in the news recently reporting that it is adding to its fleet sailing out of Shanghai, beefing up its presence in China's fast-growing leisure cruise market. That sounds bullish!
But it did report a loss last year, which is being corrected this year on the back of falling fuel costs. It does have headwinds, though. Fuel costs are "unexpectedly" rising again and the US dollar remains firm.
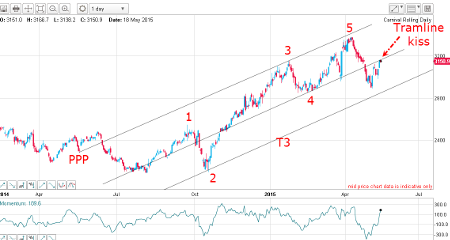
So how does the chart shape up? Here is the daily chart from last year:
(click to enlarge)
The market has rallied in five waves from the August low and I can draw a clear tramline pair (upper two tramlines) with the upper tramline sporting a nice Prior Pivot Point PPP) and accurate touch points in January and April.
The lower tramline, although not textbook, has the two major lows in February and May. Those two tramlines allowed me to draw in the third tramline T3, which gratifyingly passes through the major October low.
But today, the market has rallied to the underside of the centre tramline in what I call a "kiss". I have found that when a major tramline has been broken, the market usually comes back to that tramline and plants a kiss on it before moving sharply away in what I call a "scalded cat bounce".
In fact, that centre tramline, which represented support before the break, is now resistance.
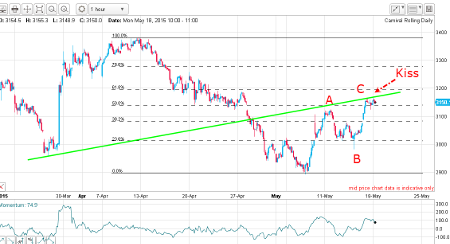
Now let's look a little closer on the hourly chart:
(click to enlarge)
The green line is my centre tramline from the daily and the market has rallied off the early May low in a clear A-B-C form, which is counter-trend. Also, the market has rallied to the Fibonacci 50% level, which is a common turning point.
So today, the shares are at a major crossroads - an ideal place to enter trades.
Outlook
Either the kiss will result in a scalded cat bounce down from near current levels, or it will catch a bid and motor on through in a continuation of the C wave.
That is a terrific set-up for a trader! If you are inclined to be bearish, a very close stop can be employed, limiting risk. Remember, I am always looking for low risk trades - and this one is superb.
These articles are provided for information purposes only. Occasionally, an opinion about whether to buy or sell a specific investment may be provided by third parties. The content is not intended to be a personal recommendation to buy or sell any financial instrument or product, or to adopt any investment strategy as it is not provided based on an assessment of your investing knowledge and experience, your financial situation or your investment objectives. The value of your investments, and the income derived from them, may go down as well as up. You may not get back all the money that you invest. The investments referred to in this article may not be suitable for all investors, and if in doubt, an investor should seek advice from a qualified investment adviser.
Full performance can be found on the company or index summary page on the interactive investor website. Simply click on the company's or index name highlighted in the article.
Disclosure
We use a combination of fundamental and technical analysis in forming our view as to the valuation and prospects of an investment. Where relevant we have set out those particular matters we think are important in the above article, but further detail can be found here.
Please note that our article on this investment should not be considered to be a regular publication.
Details of all recommendations issued by ii during the previous 12-month period can be found here.
ii adheres to a strict code of conduct. Contributors may hold shares or have other interests in companies included in these portfolios, which could create a conflict of interests. Contributors intending to write about any financial instruments in which they have an interest are required to disclose such interest to ii and in the article itself. ii will at all times consider whether such interest impairs the objectivity of the recommendation.
In addition, individuals involved in the production of investment articles are subject to a personal account dealing restriction, which prevents them from placing a transaction in the specified instrument(s) for a period before and for five working days after such publication. This is to avoid personal interests conflicting with the interests of the recipients of those investment articles.