Chart of the week: Two 'great' buy opportunities
22nd February 2016 11:11
by John Burford from interactive investor
Share on
With miners now in the spotlight, I will update two shares I have covered recently.
Update on BHP Billiton
I last covered this major miner on January 4 and, re-reading my comments, even I am amazed at how accurately I was able to predict how the shares would perform when bullish sentiment behind them was then almost non-existent. And that little episode highlights one of my core principles in investing and trading.
It is that bull markets always start when bullish sentiment is on the floor (and vice versa, of course). Bull markets never start (following a severe bear trend) from a so-so bullish sentiment position. In other words, when there is "blood in the streets", that is when savvy traders and investors act.
How can you judge what market sentiment is towards a share? After all, sentiment is a rather vague concept, is it not? I may be bullish on the share and another may equally be bearish - why else would they sell? That is what makes a market. But what is market sentiment here?
For stock indices and commodities, there are some more direct and some indirect ways to judge sentiment. One of the more direct ways is the Commitments of Traders (COT) reports which cover the markets traded on the US futures exchanges (gold being one of the most important, but individual shares not).
When a company's shares hit the front page, a trend reversal is near or has just passed
But there is no such data available for UK shares. So I go around the market and see what people are saying about the share and its sector.
For that, I use a very simple technique - I scan the mainstream media headlines. It takes a few moments to get a feel of how financial journalists are feeling.
Another rule I have is that when a company's shares hit the front page, a trend reversal of some sort is near - or has just passed.
Why are financial journalists so good at giving me an insight into the market sentiment? Simply because they reflect the public's interpretation of the news - and that is based on the discredited theory that the news makes the markets. The public - and the journalists - are herding animals and, when they see a price collapse, they read and write articles with a bearish slant.
It is the inverse of the old shoeshine boy story from the great bull market of the 1920s. When financial journalists give you tips about how bad the market is, it must be time to buy!
This was the chart for that I showed 4 January:
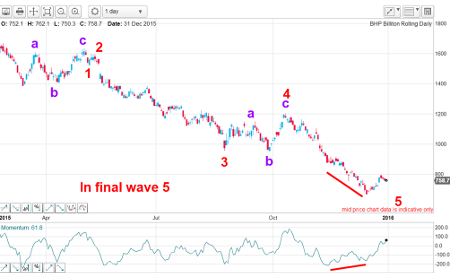
I ventured an opinion that the market was moving towards a solid low from where a recovery would start.
This was the close-up of recent action as of 4 January:
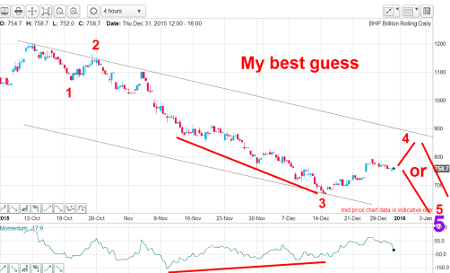
The market was moving up in a fourth wave and either it would move a little higher before trending back down to new lows in wave five of five, or it would start the decline from current levels. It was not yet time to buy or cover shorts.
This is what happened to date:
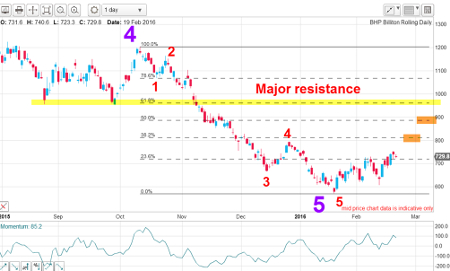
In fact, in January, the market took the low road and into sub-600p territory. That was enough to complete both fifth waves - and set the stage for a budding rally.
Outlook
The recovery from the January low has been stuttering so far. If the market can push up above the red wave four high and to the Fibonacci 38% level around 800p, then the rally should have legs and the next target at the 900p area heaves into view. And a best-case scenario of a move up to the Fibonacci 62% resistance at the 940p area would encounter solid resistance and be an opportunity to take some profits off the table.
Failing that, a move to new lows cannot be ruled out, but that would set up another great buy opportunity. The company reports first half earnings tomorrow.
FLASH: BHP opened this morning on a big gap up on the back of strong commodities.
Update on the Fresnillo wedge
Things are moving thick and fast in the precious metals arena - and that includes silver, with a push up to the recent $16-an-ounce level. With a major producer of silver, this increase in the metal is having a leveraged impact on the shares.
This was the chart I showed the last time I covered it on 8 February:
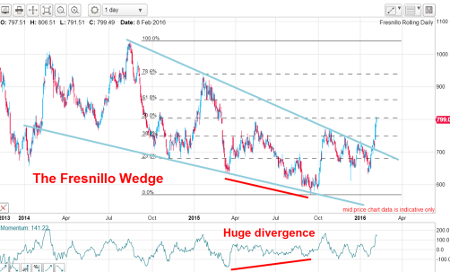
I pointed out the superb wedge where the upper wedge line break had just confirmed that a vigorous rally lay ahead, and would be a particularly sharp one because of the large momentum divergence (almost always a sure sign of a strong surge ahead).
And this is the updated chart:
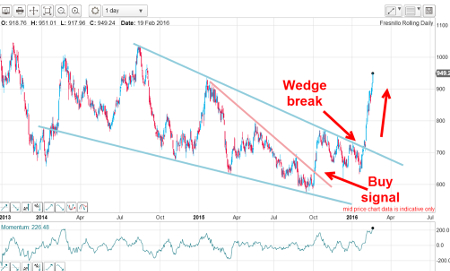
And my wish was granted - in spades (grand slam doubled!). That rally is as near-vertical as you will find on the chart of a share that was left for dead a few short weeks ago. That is the power of a volcanic sentiment change.
But there was an earlier wedge pattern with the upper line in pink. When the market moved above that last October, that was my first buy signal. My second buy signal was provided by the break through the blue wedge line.
Now, the market has moved up by almost 50% from my first buy and by 25% from my second.
Outlook
Although sharp downward corrections are likely, we are in a wave three up that should take the market towards my quoted 1,050p level and then on to my main target at the 1,300p area. Much higher potential exists, particularly if crude oil rallies towards my targets.
This article is for information and discussion purposes only and does not form a recommendation to invest or otherwise. The value of an investment may fall. The investments referred to in this article may not be suitable for all investors, and if in doubt, an investor should seek advice from a qualified investment adviser.
These articles are provided for information purposes only. Occasionally, an opinion about whether to buy or sell a specific investment may be provided by third parties. The content is not intended to be a personal recommendation to buy or sell any financial instrument or product, or to adopt any investment strategy as it is not provided based on an assessment of your investing knowledge and experience, your financial situation or your investment objectives. The value of your investments, and the income derived from them, may go down as well as up. You may not get back all the money that you invest. The investments referred to in this article may not be suitable for all investors, and if in doubt, an investor should seek advice from a qualified investment adviser.
Full performance can be found on the company or index summary page on the interactive investor website. Simply click on the company's or index name highlighted in the article.
Disclosure
We use a combination of fundamental and technical analysis in forming our view as to the valuation and prospects of an investment. Where relevant we have set out those particular matters we think are important in the above article, but further detail can be found here.
Please note that our article on this investment should not be considered to be a regular publication.
Details of all recommendations issued by ii during the previous 12-month period can be found here.
ii adheres to a strict code of conduct. Contributors may hold shares or have other interests in companies included in these portfolios, which could create a conflict of interests. Contributors intending to write about any financial instruments in which they have an interest are required to disclose such interest to ii and in the article itself. ii will at all times consider whether such interest impairs the objectivity of the recommendation.
In addition, individuals involved in the production of investment articles are subject to a personal account dealing restriction, which prevents them from placing a transaction in the specified instrument(s) for a period before and for five working days after such publication. This is to avoid personal interests conflicting with the interests of the recipients of those investment articles.