Chart of the week: The easiest trade ever
31st October 2016 13:25
by John Burford from interactive investor
Share on
Amazon takes a big hit on Friday
Almost all of the shares I cover here are UK-based large caps that I believe offer the lowest risk of a major bad surprise, such as a downside gap decline of several percent on the back of a poor earnings report and/or profit warning, for example. For spread-betters who trade on margin, that would be a wipeout, and traders cannot survive for long with too many of these.
If you have your protective stop just under the market with a large gap opening, your fill will be horrendously poor and your loss will be much, much larger than you anticipated. In fact, it could represent several tens of percent of your account valuation.
That is why I usually shun trading the most-hyped shares. This is especially so for US issues, where bullish sentiment can get really out there into the stratosphere.
And there is no other share like , where bullish sentiment has become extreme. Just recently, JP Morgan and other investment firms have raised their price target to $1,000 and higher for 2017.
The previously elusive earnings are now rising, but with the shares trading on Friday morning at $820 and annualised earnings at $2, based on Friday's third-quarter data, the latest price/earnings (PE) ratio stands at a stunning 410.
If you are buying the share with that multiple, you had better have rock-solid faith in Bezos' ability to generate much, much greater profits - and soon.
Of course, many institutions must have the share in their portfolio, at least in their tracker funds. But you don't.
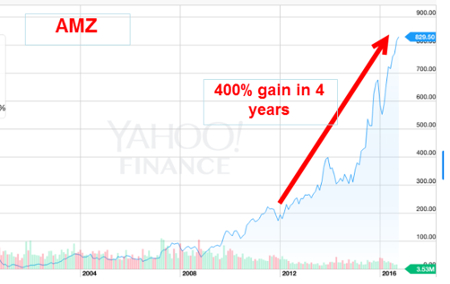
Here is the stunning bull run since 2002, which shows the growth in the past four years has been 400% - a great investment.
So any slight blip in the general expectation for a continued exponential rise in earnings should disappoint, no?
In fact, that is precisely what happened on Friday, with the shares gapping down 7% after the "shock" results emerged.
Below is the daily chart - and note Friday's big gap down way beyond the 50-day moving average (DMA) which has acted as major support since at least June. This DMA break is a major event.
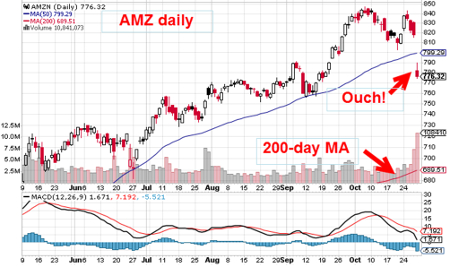
Also note where the 200 DMA is located - at the bottom right corner. That shows how far the bulls have pushed the shares up above that baseline.
This huge separation simply emphasises how high the shares have soared for so long on the back of a "can't lose" mentality. On the way down, this DMA will be a target.
And this episode illustrates why it is dangerous to follow the herd. It can work for a while, but eventually the herd falls off a cliff.
Which way Fresnillo?
I have been covering this share from its lows last winter and updated it on 12 September (Has Fresnillo made its high for 2016?). I had an upside target at around the £20 area, which it hit in July and then started backing off, as silver prices started correcting its large rally phase.
This was the chart I showed in September:
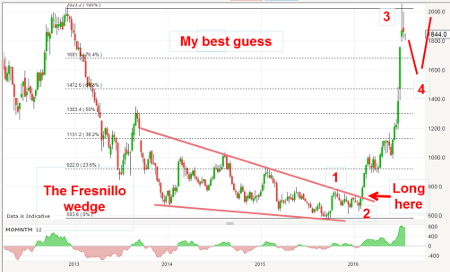
The phenomenal near-vertical rise from entry at the £7 level back in February was a solid forecast based on just the shape and long duration of the "Fresnillo wedge" coming at the end of a bear phase (as well as the contrarian bullish aspect of extreme bearish sentiment towards silver).
I pointed out that this pattern will go into the textbooks as a classic example of how an observation of a very simple chart pattern - a multi-year wedge - can accurately forecast a major trend reversal.
No knowledge of the silver mining industry, advanced macroeconomics or supply/demand factors are required! It is the ultimate example of the very simplest trading method there is.
I forecast a small decline off the wave three high at £20 to perhaps around the £16 area in wave four. That was my best guess. How is this panning out six weeks afterwards?
Here is the updated chart:
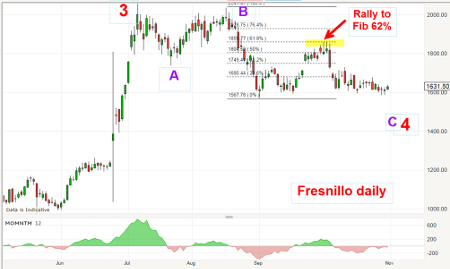
From the high, the market dipped in wave A, rallied in wave B, but not to a new high, and then dipped in what should be wave C/wave four. The £16 level (my suggested target in September) is proving to be major support, as I suspected.
Note how the September rally off the first hit on the £16 level was turned at the Fibonacci 62% resistance precisely. I have found that turns are most often made at this Fibonacci retrace level.
But bullish sentiments towards gold and silver are running very high and a further decline below the £16 level is possible. If this £16 support level holds, I am looking for a move up to test the previous £18 high, in what should be the final fifth wave up.
With US elections about a week away, we could see increased volatility with some spiky moves, so be careful!
This article is for information and discussion purposes only and does not form a recommendation to invest or otherwise. The value of an investment may fall. The investments referred to in this article may not be suitable for all investors, and if in doubt, an investor should seek advice from a qualified investment adviser.
These articles are provided for information purposes only. Occasionally, an opinion about whether to buy or sell a specific investment may be provided by third parties. The content is not intended to be a personal recommendation to buy or sell any financial instrument or product, or to adopt any investment strategy as it is not provided based on an assessment of your investing knowledge and experience, your financial situation or your investment objectives. The value of your investments, and the income derived from them, may go down as well as up. You may not get back all the money that you invest. The investments referred to in this article may not be suitable for all investors, and if in doubt, an investor should seek advice from a qualified investment adviser.
Full performance can be found on the company or index summary page on the interactive investor website. Simply click on the company's or index name highlighted in the article.
Disclosure
We use a combination of fundamental and technical analysis in forming our view as to the valuation and prospects of an investment. Where relevant we have set out those particular matters we think are important in the above article, but further detail can be found here.
Please note that our article on this investment should not be considered to be a regular publication.
Details of all recommendations issued by ii during the previous 12-month period can be found here.
ii adheres to a strict code of conduct. Contributors may hold shares or have other interests in companies included in these portfolios, which could create a conflict of interests. Contributors intending to write about any financial instruments in which they have an interest are required to disclose such interest to ii and in the article itself. ii will at all times consider whether such interest impairs the objectivity of the recommendation.
In addition, individuals involved in the production of investment articles are subject to a personal account dealing restriction, which prevents them from placing a transaction in the specified instrument(s) for a period before and for five working days after such publication. This is to avoid personal interests conflicting with the interests of the recipients of those investment articles.