Chart of the week: Top called on this blue-chip
27th March 2017 12:44
by John Burford from interactive investor
Share on
A lesson in tramline trading in Rio Tinto
I have been bullish on this share for some months, but in my COTW of 6 March, I laid out a case that the recent high around £36 would represent a major top. I believed the decline could be significant.
As usual, I based this forecast on the technical picture. Many investors/traders act emotionally and, when presented with a good profit, rush to lock in the gains with no regard to the technical picture. That often means missing out on some great moves.
If that sad event occurs, it is natural to feel somewhat of a fool for rushing to get out too early – and it is also natural to vow to make it back in what I call the Get Even gambit. But you may then be rushing into a trade recklessly. And that would be compounding emotion upon emotion – a double whammy.
No, much better to use reliable methods for entering and exiting positions, as I describe in my blogs. Of course, my methods are not the only ones to provide excellent signals, but they are among the very simplest to put into practice with a minimum of elements.
My motto? It is the KISS principle - Keep It Simple, Stupid!
And, in , I have a terrific example of how to use my simple tramline methods.
Here is the weekly chart I showed on 6 March
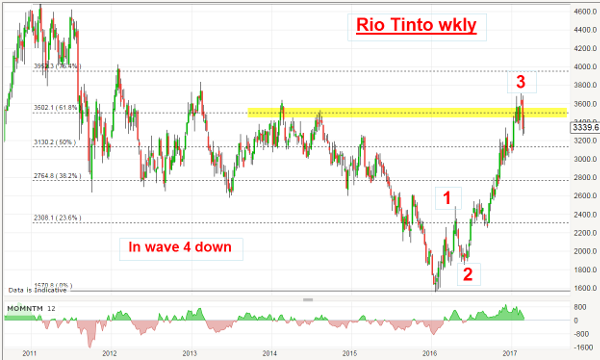
The year 2015 was marked by a relentless bear trend taking the shares to a low of £16 in January 2016, and that was the time when I started to get interested in the bullish potential.
Contrary to expectations by the 'experts', metal prices started a huge recovery and the shares followed up to reach the £36 area in February of this year. At this level, the shares had recovered a Fibonacci 62% of the decline off the 2011 highs around £46.
So, with that important level of resistance having been achieved, I needed clues that the market was about to turn back down to prompt me to look to take some profits off the table. Note that I did not recommend simply exiting my trades because it had hit an important Fibonacci level. I needed a little more evidence for a turn. And the market gave me plenty. Here is the updated daily chart
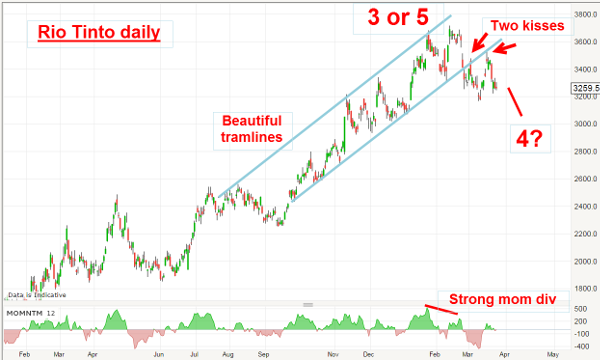
The final rally phase from August is contained in the trading channel between my blue tramlines. It is a multi-month thing of beauty for tramline watchers! The upper tramline has at least four accurate touch points, while the lower line sports at least six, making the pair highly reliable lines of support (lower) and resistance (upper).
I knew that when one of the tramlines was to be penetrated, that would be a significant tradeable event - and when the lower tramline was broken on 24 February, that was my signal to start looking to exit my longs and to position short.
I also knew that when a long-standing lower tramline was broken, it is usual for a rally to plant a kiss on the tramline underside – and then move sharply lower in a scalded cat bounce.
And that is precisely what occurred. In fact, the market planted two kisses and then last week started moving lower. Taking profits on any of the kisses was a good strategy in accordance with my trading rules. Also, reversing and shorting at the same time was likewise a good bet because the market had already signalled the trend had very likely turned to down.
Here is a close-up of that action
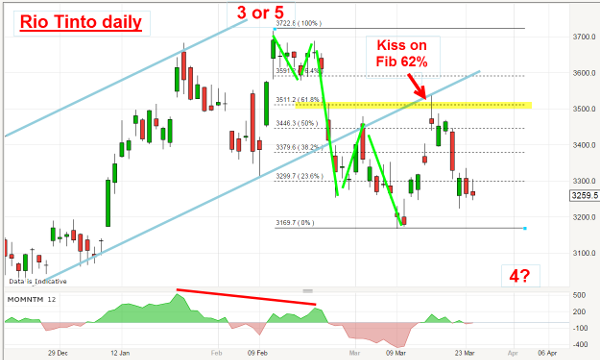
I had marked the £36 high as wave 3 previously, but there was an alternative label – it could be a final wave 5 up. To my mind, it was a toss-up.
Of course, if we have seen the final highs in wave 5, we should expect a small scale five-down off that high – and that is exactly what we have (the five is marked by the green lines). I normally want to see such a small five-down before calling the top – and here it is.
With the shares trading down to the £31.50 level in a new low this morning, it appears my bearish call is correct. That is the power of using my simple tramline methods.
These articles are provided for information purposes only. Occasionally, an opinion about whether to buy or sell a specific investment may be provided by third parties. The content is not intended to be a personal recommendation to buy or sell any financial instrument or product, or to adopt any investment strategy as it is not provided based on an assessment of your investing knowledge and experience, your financial situation or your investment objectives. The value of your investments, and the income derived from them, may go down as well as up. You may not get back all the money that you invest. The investments referred to in this article may not be suitable for all investors, and if in doubt, an investor should seek advice from a qualified investment adviser.
Full performance can be found on the company or index summary page on the interactive investor website. Simply click on the company's or index name highlighted in the article.
Disclosure
We use a combination of fundamental and technical analysis in forming our view as to the valuation and prospects of an investment. Where relevant we have set out those particular matters we think are important in the above article, but further detail can be found here.
Please note that our article on this investment should not be considered to be a regular publication.
Details of all recommendations issued by ii during the previous 12-month period can be found here.
ii adheres to a strict code of conduct. Contributors may hold shares or have other interests in companies included in these portfolios, which could create a conflict of interests. Contributors intending to write about any financial instruments in which they have an interest are required to disclose such interest to ii and in the article itself. ii will at all times consider whether such interest impairs the objectivity of the recommendation.
In addition, individuals involved in the production of investment articles are subject to a personal account dealing restriction, which prevents them from placing a transaction in the specified instrument(s) for a period before and for five working days after such publication. This is to avoid personal interests conflicting with the interests of the recipients of those investment articles.