Chart of the week: Why this blue-chip should rally from here
2nd May 2017 11:56
by John Burford from interactive investor
Share on
Has the Rio Tinto rally ended?
I have been covering these shares since made their lows late last year when I turned bullish. My latest coverage was on the 6th March when the shares had rallied to the £36 area from last year's lows around £16 on the back of the 'surprise' rally in metals. Then, I suggested the rally had run its course and a period of correction (at least) was due. This was a great opportunity to take some profits off the table.
But has the market behaved as I expected since early March and was my profit-taking warning justified?
To review my take on the long-term trend, here is the weekly chart going back to 2005:
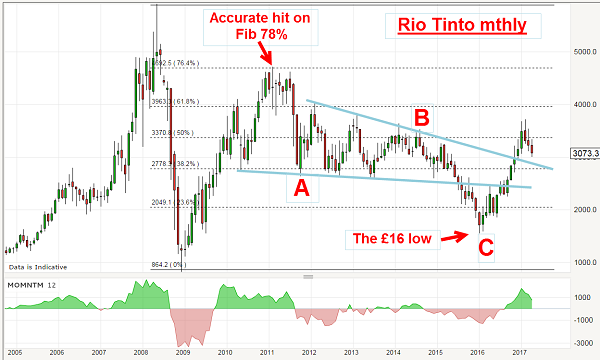
One glance at this chart should convince you why I am not a buy-and-hold man! If you had bought on the run-up to the 2008 high, chances are that, at best, you would probabaly be breaking about even (not allowing for dividends, of course). That is not a terrific return after 10 or more years holding the position. Sadly, many retail investors do just that.
Also, you might have had several near heart attacks in the meantime as you witnessed the roller-coaster ride from a low of £10 to a high near £60. Only those investors with steel nerves (or those that never look at their broker's statements) could have handled this kind of action with equanimity.
And that is why I am a swing trader - as I try to capture the large up and down moves by attempting to locate the major trend changes.
There are several interesting features in the chart. The rally off the 2008/2009 crash made it to the Fibonacci 78% resistance level on the button that once again confirms the sheer practical utility of placing Fibonacci levels on the most recent major swing. These often give highly accurate targets where profits can be taken.
From that extreme volatility, the market more or less settled down with trading confined to the wedge contained between my blue lines. That was a period where I avoided trading these shares. But the bear took over again in 2014, and by early 2016, the low at £16 was put in. That was when I became a bull when almost everyone else was convinced the big miners were toast as base metal prices had plunged, demand was said to be weak since China was slowing, and they were dumping steel at rock bottom prices.
If you had acted on this bearish story, you would have missed one of the biggest profit opportunities at the time. But we didn't because I knew that when sentiment becomes extreme, it is a great idea to take the other side of that trade (with good timing, of course).
So let me zoom in on the rally off the £16 low. Here is the weekly chart:
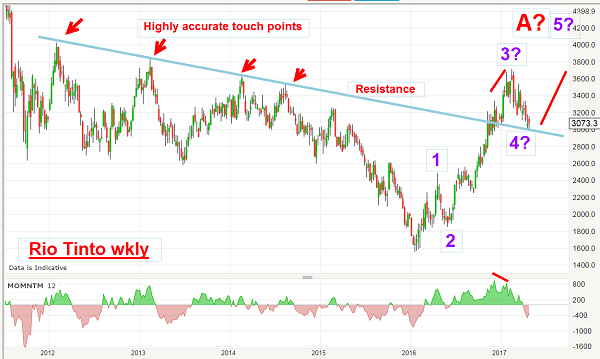
On this scale you can see the four remarkably accurate touch points on the blue resistance line, which makes it a highly significant line. And when the market burst up through it in November last year, it became a line of support.
In March, with the shares near their high around £36, I suggested that because this was a Fibonacci 62% retrace of the entire bear trend, that was a great place to take some profits. My outlook was for a decent pull-back in the near-term.
And so it has proved, with the shares touching the £30 level recently. But as you can see on the above chart, this is the area of major support provided by our old friend the blue line!
That allows my Elliott wave labels as shown with the current dip being wave 4 and the start of wave 5 up to what could be a large A wave.
With strong support just under the current market, we should rally from near here. But if it doesn't and moves hard down through the blue line, all bullish bets are off and my wave labels would need to be adjusted.
But the bottom line is that I rode a bull trend from near the lows, took some great profit near the £36 high and still hold a position that at worst will be a wash. Net result? A profit! And that is what we are all after, is it not?
These articles are provided for information purposes only. Occasionally, an opinion about whether to buy or sell a specific investment may be provided by third parties. The content is not intended to be a personal recommendation to buy or sell any financial instrument or product, or to adopt any investment strategy as it is not provided based on an assessment of your investing knowledge and experience, your financial situation or your investment objectives. The value of your investments, and the income derived from them, may go down as well as up. You may not get back all the money that you invest. The investments referred to in this article may not be suitable for all investors, and if in doubt, an investor should seek advice from a qualified investment adviser.
Full performance can be found on the company or index summary page on the interactive investor website. Simply click on the company's or index name highlighted in the article.
Disclosure
We use a combination of fundamental and technical analysis in forming our view as to the valuation and prospects of an investment. Where relevant we have set out those particular matters we think are important in the above article, but further detail can be found here.
Please note that our article on this investment should not be considered to be a regular publication.
Details of all recommendations issued by ii during the previous 12-month period can be found here.
ii adheres to a strict code of conduct. Contributors may hold shares or have other interests in companies included in these portfolios, which could create a conflict of interests. Contributors intending to write about any financial instruments in which they have an interest are required to disclose such interest to ii and in the article itself. ii will at all times consider whether such interest impairs the objectivity of the recommendation.
In addition, individuals involved in the production of investment articles are subject to a personal account dealing restriction, which prevents them from placing a transaction in the specified instrument(s) for a period before and for five working days after such publication. This is to avoid personal interests conflicting with the interests of the recipients of those investment articles.